Warning (2)ROOT/vendor/pchart/pchart/pchart.php , line 514 ]Code Context
$this -> DivisionHeight = ( $this -> GArea_Y2 - $this -> GArea_Y1 ) / $Divisions ;
$this -> DivisionRatio = ( $this -> GArea_Y2 - $this -> GArea_Y1 ) / $DataRange ;
$Data = [
(int) 0 => [
'P' => (float) 20.8,
'Name' => (int) 0,
'trend' => false,
'years' => (int) 1901
],
(int) 1 => [
'P' => (float) 20.8,
'Name' => (int) 1,
'trend' => false,
'years' => (int) 1902
],
(int) 2 => [
'P' => (float) 20.8,
'Name' => (int) 2,
'trend' => false,
'years' => (int) 1903
],
(int) 3 => [
'P' => (float) 20.8,
'Name' => (int) 3,
'trend' => false,
'years' => (int) 1904
],
(int) 4 => [
'P' => (float) 20.8,
'Name' => (int) 4,
'trend' => false,
'years' => (int) 1905
],
(int) 5 => [
'P' => (float) 20.8,
'Name' => (int) 5,
'trend' => false,
'years' => (int) 1906
],
(int) 6 => [
'P' => (float) 20.8,
'Name' => (int) 6,
'trend' => false,
'years' => (int) 1907
],
(int) 7 => [
'P' => (float) 20.8,
'Name' => (int) 7,
'trend' => false,
'years' => (int) 1908
],
(int) 8 => [
'P' => (float) 20.8,
'Name' => (int) 8,
'trend' => false,
'years' => (int) 1909
],
(int) 9 => [
'P' => (float) 20.8,
'Name' => (int) 9,
'trend' => false,
'years' => (int) 1910
],
(int) 10 => [
'P' => (float) 20.8,
'Name' => (int) 10,
'trend' => (float) 20.8,
'years' => (int) 1911
],
(int) 11 => [
'P' => (float) 20.8,
'Name' => (int) 11,
'trend' => (float) 20.8,
'years' => (int) 1912
],
(int) 12 => [
'P' => (float) 20.8,
'Name' => (int) 12,
'trend' => (float) 20.8,
'years' => (int) 1913
],
(int) 13 => [
'P' => (float) 20.8,
'Name' => (int) 13,
'trend' => (float) 20.8,
'years' => (int) 1914
],
(int) 14 => [
'P' => (float) 20.8,
'Name' => (int) 14,
'trend' => (float) 20.8,
'years' => (int) 1915
],
(int) 15 => [
'P' => (float) 20.8,
'Name' => (int) 15,
'trend' => (float) 20.8,
'years' => (int) 1916
],
(int) 16 => [
'P' => (float) 20.8,
'Name' => (int) 16,
'trend' => (float) 20.8,
'years' => (int) 1917
],
(int) 17 => [
'P' => (float) 20.8,
'Name' => (int) 17,
'trend' => (float) 20.8,
'years' => (int) 1918
],
(int) 18 => [
'P' => (float) 20.8,
'Name' => (int) 18,
'trend' => (float) 20.8,
'years' => (int) 1919
],
(int) 19 => [
'P' => (float) 20.8,
'Name' => (int) 19,
'trend' => (float) 20.8,
'years' => (int) 1920
],
(int) 20 => [
'P' => (float) 20.8,
'Name' => (int) 20,
'trend' => (float) 20.8,
'years' => (int) 1921
],
(int) 21 => [
'P' => (float) 20.8,
'Name' => (int) 21,
'trend' => (float) 20.8,
'years' => (int) 1922
],
(int) 22 => [
'P' => (float) 20.8,
'Name' => (int) 22,
'trend' => (float) 20.8,
'years' => (int) 1923
],
(int) 23 => [
'P' => (float) 20.8,
'Name' => (int) 23,
'trend' => (float) 20.8,
'years' => (int) 1924
],
(int) 24 => [
'P' => (float) 20.8,
'Name' => (int) 24,
'trend' => (float) 20.8,
'years' => (int) 1925
],
(int) 25 => [
'P' => (float) 20.8,
'Name' => (int) 25,
'trend' => (float) 20.8,
'years' => (int) 1926
],
(int) 26 => [
'P' => (float) 20.8,
'Name' => (int) 26,
'trend' => (float) 20.8,
'years' => (int) 1927
],
(int) 27 => [
'P' => (float) 20.8,
'Name' => (int) 27,
'trend' => (float) 20.8,
'years' => (int) 1928
],
(int) 28 => [
'P' => (float) 20.8,
'Name' => (int) 28,
'trend' => (float) 20.8,
'years' => (int) 1929
],
(int) 29 => [
'P' => (float) 20.8,
'Name' => (int) 29,
'trend' => (float) 20.8,
'years' => (int) 1930
],
(int) 30 => [
'P' => (float) 20.8,
'Name' => (int) 30,
'trend' => (float) 20.8,
'years' => (int) 1931
],
(int) 31 => [
'P' => (float) 20.8,
'Name' => (int) 31,
'trend' => (float) 20.8,
'years' => (int) 1932
],
(int) 32 => [
'P' => (float) 20.8,
'Name' => (int) 32,
'trend' => (float) 20.8,
'years' => (int) 1933
],
(int) 33 => [
'P' => (float) 20.8,
'Name' => (int) 33,
'trend' => (float) 20.8,
'years' => (int) 1934
],
(int) 34 => [
'P' => (float) 20.8,
'Name' => (int) 34,
'trend' => (float) 20.8,
'years' => (int) 1935
],
(int) 35 => [
'P' => (float) 20.8,
'Name' => (int) 35,
'trend' => (float) 20.8,
'years' => (int) 1936
],
(int) 36 => [
'P' => (float) 20.8,
'Name' => (int) 36,
'trend' => (float) 20.8,
'years' => (int) 1937
],
(int) 37 => [
'P' => (float) 20.8,
'Name' => (int) 37,
'trend' => (float) 20.8,
'years' => (int) 1938
],
(int) 38 => [
'P' => (float) 20.8,
'Name' => (int) 38,
'trend' => (float) 20.8,
'years' => (int) 1939
],
(int) 39 => [
'P' => (float) 20.8,
'Name' => (int) 39,
'trend' => (float) 20.8,
'years' => (int) 1940
],
(int) 40 => [
'P' => (float) 20.8,
'Name' => (int) 40,
'trend' => (float) 20.8,
'years' => (int) 1941
],
(int) 41 => [
'P' => (float) 20.8,
'Name' => (int) 41,
'trend' => (float) 20.8,
'years' => (int) 1942
],
(int) 42 => [
'P' => (float) 20.8,
'Name' => (int) 42,
'trend' => (float) 20.8,
'years' => (int) 1943
],
(int) 43 => [
'P' => (float) 20.8,
'Name' => (int) 43,
'trend' => (float) 20.8,
'years' => (int) 1944
],
(int) 44 => [
'P' => (float) 20.8,
'Name' => (int) 44,
'trend' => (float) 20.8,
'years' => (int) 1945
],
(int) 45 => [
'P' => (float) 20.8,
'Name' => (int) 45,
'trend' => (float) 20.8,
'years' => (int) 1946
],
(int) 46 => [
'P' => (float) 20.8,
'Name' => (int) 46,
'trend' => (float) 20.8,
'years' => (int) 1947
],
(int) 47 => [
'P' => (float) 20.8,
'Name' => (int) 47,
'trend' => (float) 20.8,
'years' => (int) 1948
],
(int) 48 => [
'P' => (float) 20.8,
'Name' => (int) 48,
'trend' => (float) 20.8,
'years' => (int) 1949
],
(int) 49 => [
'P' => (float) 20.8,
'Name' => (int) 49,
'trend' => (float) 20.8,
'years' => (int) 1950
],
(int) 50 => [
'P' => (float) 20.8,
'Name' => (int) 50,
'trend' => (float) 20.8,
'years' => (int) 1951
],
(int) 51 => [
'P' => (float) 20.8,
'Name' => (int) 51,
'trend' => (float) 20.8,
'years' => (int) 1952
],
(int) 52 => [
'P' => (float) 20.8,
'Name' => (int) 52,
'trend' => (float) 20.8,
'years' => (int) 1953
],
(int) 53 => [
'P' => (float) 20.8,
'Name' => (int) 53,
'trend' => (float) 20.8,
'years' => (int) 1954
],
(int) 54 => [
'P' => (float) 20.8,
'Name' => (int) 54,
'trend' => (float) 20.8,
'years' => (int) 1955
],
(int) 55 => [
'P' => (float) 20.8,
'Name' => (int) 55,
'trend' => (float) 20.8,
'years' => (int) 1956
],
(int) 56 => [
'P' => (float) 20.8,
'Name' => (int) 56,
'trend' => (float) 20.8,
'years' => (int) 1957
],
(int) 57 => [
'P' => (float) 20.8,
'Name' => (int) 57,
'trend' => (float) 20.8,
'years' => (int) 1958
],
(int) 58 => [
'P' => (float) 20.8,
'Name' => (int) 58,
'trend' => (float) 20.8,
'years' => (int) 1959
],
(int) 59 => [
'P' => (float) 20.8,
'Name' => (int) 59,
'trend' => (float) 20.8,
'years' => (int) 1960
],
(int) 60 => [
'P' => (float) 20.8,
'Name' => (int) 60,
'trend' => (float) 20.8,
'years' => (int) 1961
],
(int) 61 => [
'P' => (float) 20.8,
'Name' => (int) 61,
'trend' => (float) 20.8,
'years' => (int) 1962
],
(int) 62 => [
'P' => (float) 20.8,
'Name' => (int) 62,
'trend' => (float) 20.8,
'years' => (int) 1963
],
(int) 63 => [
'P' => (float) 20.8,
'Name' => (int) 63,
'trend' => (float) 20.8,
'years' => (int) 1964
],
(int) 64 => [
'P' => (float) 20.8,
'Name' => (int) 64,
'trend' => (float) 20.8,
'years' => (int) 1965
],
(int) 65 => [
'P' => (float) 20.8,
'Name' => (int) 65,
'trend' => (float) 20.8,
'years' => (int) 1966
],
(int) 66 => [
'P' => (float) 20.8,
'Name' => (int) 66,
'trend' => (float) 20.8,
'years' => (int) 1967
],
(int) 67 => [
'P' => (float) 20.8,
'Name' => (int) 67,
'trend' => (float) 20.8,
'years' => (int) 1968
],
(int) 68 => [
'P' => (float) 20.8,
'Name' => (int) 68,
'trend' => (float) 20.8,
'years' => (int) 1969
],
(int) 69 => [
'P' => (float) 20.8,
'Name' => (int) 69,
'trend' => (float) 20.8,
'years' => (int) 1970
],
(int) 70 => [
'P' => (float) 20.8,
'Name' => (int) 70,
'trend' => (float) 20.8,
'years' => (int) 1971
],
(int) 71 => [
'P' => (float) 20.8,
'Name' => (int) 71,
'trend' => (float) 20.8,
'years' => (int) 1972
],
(int) 72 => [
'P' => (float) 20.8,
'Name' => (int) 72,
'trend' => (float) 20.8,
'years' => (int) 1973
],
(int) 73 => [
'P' => (float) 20.8,
'Name' => (int) 73,
'trend' => (float) 20.8,
'years' => (int) 1974
],
(int) 74 => [
'P' => (float) 20.8,
'Name' => (int) 74,
'trend' => (float) 20.8,
'years' => (int) 1975
],
(int) 75 => [
'P' => (float) 20.8,
'Name' => (int) 75,
'trend' => (float) 20.8,
'years' => (int) 1976
],
(int) 76 => [
'P' => (float) 20.8,
'Name' => (int) 76,
'trend' => (float) 20.8,
'years' => (int) 1977
],
(int) 77 => [
'P' => (float) 20.8,
'Name' => (int) 77,
'trend' => (float) 20.8,
'years' => (int) 1978
],
(int) 78 => [
'P' => (float) 20.8,
'Name' => (int) 78,
'trend' => (float) 20.8,
'years' => (int) 1979
],
(int) 79 => [
'P' => (float) 20.8,
'Name' => (int) 79,
'trend' => (float) 20.8,
'years' => (int) 1980
],
(int) 80 => [
'P' => (float) 20.8,
'Name' => (int) 80,
'trend' => (float) 20.8,
'years' => (int) 1981
],
(int) 81 => [
'P' => (float) 20.8,
'Name' => (int) 81,
'trend' => (float) 20.8,
'years' => (int) 1982
],
(int) 82 => [
'P' => (float) 20.8,
'Name' => (int) 82,
'trend' => (float) 20.8,
'years' => (int) 1983
],
(int) 83 => [
'P' => (float) 20.8,
'Name' => (int) 83,
'trend' => (float) 20.8,
'years' => (int) 1984
],
(int) 84 => [
'P' => (float) 20.8,
'Name' => (int) 84,
'trend' => (float) 20.8,
'years' => (int) 1985
],
(int) 85 => [
'P' => (float) 20.8,
'Name' => (int) 85,
'trend' => (float) 20.8,
'years' => (int) 1986
],
(int) 86 => [
'P' => (float) 20.8,
'Name' => (int) 86,
'trend' => (float) 20.8,
'years' => (int) 1987
],
(int) 87 => [
'P' => (float) 20.8,
'Name' => (int) 87,
'trend' => (float) 20.8,
'years' => (int) 1988
],
(int) 88 => [
'P' => (float) 20.8,
'Name' => (int) 88,
'trend' => (float) 20.8,
'years' => (int) 1989
],
(int) 89 => [
'P' => (float) 20.8,
'Name' => (int) 89,
'trend' => (float) 20.8,
'years' => (int) 1990
],
(int) 90 => [
'P' => (float) 20.8,
'Name' => (int) 90,
'trend' => (float) 20.8,
'years' => (int) 1991
],
(int) 91 => [
'P' => (float) 20.8,
'Name' => (int) 91,
'trend' => (float) 20.8,
'years' => (int) 1992
],
(int) 92 => [
'P' => (float) 20.8,
'Name' => (int) 92,
'trend' => (float) 20.8,
'years' => (int) 1993
],
(int) 93 => [
'P' => (float) 20.8,
'Name' => (int) 93,
'trend' => (float) 20.8,
'years' => (int) 1994
],
(int) 94 => [
'P' => (float) 20.8,
'Name' => (int) 94,
'trend' => (float) 20.8,
'years' => (int) 1995
],
(int) 95 => [
'P' => (float) 20.8,
'Name' => (int) 95,
'trend' => (float) 20.8,
'years' => (int) 1996
],
(int) 96 => [
'P' => (float) 20.8,
'Name' => (int) 96,
'trend' => (float) 20.8,
'years' => (int) 1997
],
(int) 97 => [
'P' => (float) 20.8,
'Name' => (int) 97,
'trend' => (float) 20.8,
'years' => (int) 1998
],
(int) 98 => [
'P' => (float) 20.8,
'Name' => (int) 98,
'trend' => (float) 20.8,
'years' => (int) 1999
],
(int) 99 => [
'P' => (float) 20.8,
'Name' => (int) 99,
'trend' => false,
'years' => (int) 2000
],
(int) 100 => [
'P' => (float) 20.8,
'Name' => (int) 100,
'trend' => false,
'years' => (int) 2001
],
(int) 101 => [
'P' => (float) 20.8,
'Name' => (int) 101,
'trend' => false,
'years' => (int) 2002
],
(int) 102 => [
'P' => (float) 20.8,
'Name' => (int) 102,
'trend' => false,
'years' => (int) 2003
],
(int) 103 => [
'P' => (float) 20.8,
'Name' => (int) 103,
'trend' => false,
'years' => (int) 2004
],
(int) 104 => [
'P' => (float) 20.8,
'Name' => (int) 104,
'trend' => false,
'years' => (int) 2005
],
(int) 105 => [
'P' => (float) 20.8,
'Name' => (int) 105,
'trend' => false,
'years' => (int) 2006
],
(int) 106 => [
'P' => (float) 20.8,
'Name' => (int) 106,
'trend' => false,
'years' => (int) 2007
],
(int) 107 => [
'P' => (float) 20.8,
'Name' => (int) 107,
'trend' => false,
'years' => (int) 2008
],
(int) 108 => [
'P' => (float) 20.8,
'Name' => (int) 108,
'trend' => false,
'years' => (int) 2009
]
]
$DataDescription = [
'Position' => 'years',
'Format' => [
'X' => 'number',
'Y' => 'number'
],
'Unit' => [
'X' => null,
'Y' => ' cm'
],
'Values' => [
(int) 0 => 'P',
(int) 1 => 'trend'
],
'Description' => [
'P' => 'Precipitation',
'trend' => '20 Yr Trend'
],
'Axis' => [
'X' => 'Year',
'Y' => 'Precipitation'
]
]
$ScaleMode = (int) 1
$R = (int) 100
$G = (int) 100
$B = (int) 100
$DrawTicks = true
$Angle = (int) 0
$Decimals = (int) 0
$WithMargin = false
$SkipLabels = (int) 10
$RightScale = false
$C_TextColor = (int) 6579300
$Values = [
'P' => (float) 20.8,
'Name' => (int) 108,
'trend' => false,
'years' => (int) 2009
]
$Key = (int) 108
$ColName = 'trend'
$Key2 = (int) 1
$Value = false
$DataRange = (float) 0.2
$ScaleOk = true
$Factor = (float) 0.1
$MaxDivs = (float) 13.2
$Scale = (int) 1
$Divisions = (float) 0
$Scale1 = (float) 2
$Scale2 = (float) 1
$Scale4 = (float) 0.5 pChart::drawScale() - ROOT/vendor/pchart/pchart/pchart.php, line 514
App\Controller\GeographicsController::_yrtotprecip() - APP/Controller/GeographicsController.php, line 443
App\Controller\GeographicsController::climate() - APP/Controller/GeographicsController.php, line 140
Cake\Controller\Controller::invokeAction() - CORE/src/Controller/Controller.php, line 609
Cake\Http\ActionDispatcher::_invoke() - CORE/src/Http/ActionDispatcher.php, line 120
Cake\Http\ActionDispatcher::dispatch() - CORE/src/Http/ActionDispatcher.php, line 94
Cake\Http\BaseApplication::__invoke() - CORE/src/Http/BaseApplication.php, line 235
Cake\Http\Runner::__invoke() - CORE/src/Http/Runner.php, line 65
Cake\Routing\Middleware\RoutingMiddleware::__invoke() - CORE/src/Routing/Middleware/RoutingMiddleware.php, line 156
Cake\Http\Runner::__invoke() - CORE/src/Http/Runner.php, line 65
Cake\Routing\Middleware\AssetMiddleware::__invoke() - CORE/src/Routing/Middleware/AssetMiddleware.php, line 88
Cake\Http\Runner::__invoke() - CORE/src/Http/Runner.php, line 65
Cake\Error\Middleware\ErrorHandlerMiddleware::__invoke() - CORE/src/Error/Middleware/ErrorHandlerMiddleware.php, line 98
Cake\Http\Runner::__invoke() - CORE/src/Http/Runner.php, line 65
Cake\Http\Runner::run() - CORE/src/Http/Runner.php, line 51
Cake\Http\Server::run() - CORE/src/Http/Server.php, line 98
[main] - ROOT/webroot/index.php, line 40 Warning (2)ROOT/vendor/pchart/pchart/pchart.php , line 547 ]Code Context
$Value = $this -> VMin + ( $i - 1 ) * (( $this -> VMax - $this -> VMin ) / $Divisions );
$Value = round ( $Value * pow ( 10 , $Decimals )) / pow ( 10 , $Decimals );
$Data = [
(int) 0 => [
'P' => (float) 20.8,
'Name' => (int) 0,
'trend' => false,
'years' => (int) 1901
],
(int) 1 => [
'P' => (float) 20.8,
'Name' => (int) 1,
'trend' => false,
'years' => (int) 1902
],
(int) 2 => [
'P' => (float) 20.8,
'Name' => (int) 2,
'trend' => false,
'years' => (int) 1903
],
(int) 3 => [
'P' => (float) 20.8,
'Name' => (int) 3,
'trend' => false,
'years' => (int) 1904
],
(int) 4 => [
'P' => (float) 20.8,
'Name' => (int) 4,
'trend' => false,
'years' => (int) 1905
],
(int) 5 => [
'P' => (float) 20.8,
'Name' => (int) 5,
'trend' => false,
'years' => (int) 1906
],
(int) 6 => [
'P' => (float) 20.8,
'Name' => (int) 6,
'trend' => false,
'years' => (int) 1907
],
(int) 7 => [
'P' => (float) 20.8,
'Name' => (int) 7,
'trend' => false,
'years' => (int) 1908
],
(int) 8 => [
'P' => (float) 20.8,
'Name' => (int) 8,
'trend' => false,
'years' => (int) 1909
],
(int) 9 => [
'P' => (float) 20.8,
'Name' => (int) 9,
'trend' => false,
'years' => (int) 1910
],
(int) 10 => [
'P' => (float) 20.8,
'Name' => (int) 10,
'trend' => (float) 20.8,
'years' => (int) 1911
],
(int) 11 => [
'P' => (float) 20.8,
'Name' => (int) 11,
'trend' => (float) 20.8,
'years' => (int) 1912
],
(int) 12 => [
'P' => (float) 20.8,
'Name' => (int) 12,
'trend' => (float) 20.8,
'years' => (int) 1913
],
(int) 13 => [
'P' => (float) 20.8,
'Name' => (int) 13,
'trend' => (float) 20.8,
'years' => (int) 1914
],
(int) 14 => [
'P' => (float) 20.8,
'Name' => (int) 14,
'trend' => (float) 20.8,
'years' => (int) 1915
],
(int) 15 => [
'P' => (float) 20.8,
'Name' => (int) 15,
'trend' => (float) 20.8,
'years' => (int) 1916
],
(int) 16 => [
'P' => (float) 20.8,
'Name' => (int) 16,
'trend' => (float) 20.8,
'years' => (int) 1917
],
(int) 17 => [
'P' => (float) 20.8,
'Name' => (int) 17,
'trend' => (float) 20.8,
'years' => (int) 1918
],
(int) 18 => [
'P' => (float) 20.8,
'Name' => (int) 18,
'trend' => (float) 20.8,
'years' => (int) 1919
],
(int) 19 => [
'P' => (float) 20.8,
'Name' => (int) 19,
'trend' => (float) 20.8,
'years' => (int) 1920
],
(int) 20 => [
'P' => (float) 20.8,
'Name' => (int) 20,
'trend' => (float) 20.8,
'years' => (int) 1921
],
(int) 21 => [
'P' => (float) 20.8,
'Name' => (int) 21,
'trend' => (float) 20.8,
'years' => (int) 1922
],
(int) 22 => [
'P' => (float) 20.8,
'Name' => (int) 22,
'trend' => (float) 20.8,
'years' => (int) 1923
],
(int) 23 => [
'P' => (float) 20.8,
'Name' => (int) 23,
'trend' => (float) 20.8,
'years' => (int) 1924
],
(int) 24 => [
'P' => (float) 20.8,
'Name' => (int) 24,
'trend' => (float) 20.8,
'years' => (int) 1925
],
(int) 25 => [
'P' => (float) 20.8,
'Name' => (int) 25,
'trend' => (float) 20.8,
'years' => (int) 1926
],
(int) 26 => [
'P' => (float) 20.8,
'Name' => (int) 26,
'trend' => (float) 20.8,
'years' => (int) 1927
],
(int) 27 => [
'P' => (float) 20.8,
'Name' => (int) 27,
'trend' => (float) 20.8,
'years' => (int) 1928
],
(int) 28 => [
'P' => (float) 20.8,
'Name' => (int) 28,
'trend' => (float) 20.8,
'years' => (int) 1929
],
(int) 29 => [
'P' => (float) 20.8,
'Name' => (int) 29,
'trend' => (float) 20.8,
'years' => (int) 1930
],
(int) 30 => [
'P' => (float) 20.8,
'Name' => (int) 30,
'trend' => (float) 20.8,
'years' => (int) 1931
],
(int) 31 => [
'P' => (float) 20.8,
'Name' => (int) 31,
'trend' => (float) 20.8,
'years' => (int) 1932
],
(int) 32 => [
'P' => (float) 20.8,
'Name' => (int) 32,
'trend' => (float) 20.8,
'years' => (int) 1933
],
(int) 33 => [
'P' => (float) 20.8,
'Name' => (int) 33,
'trend' => (float) 20.8,
'years' => (int) 1934
],
(int) 34 => [
'P' => (float) 20.8,
'Name' => (int) 34,
'trend' => (float) 20.8,
'years' => (int) 1935
],
(int) 35 => [
'P' => (float) 20.8,
'Name' => (int) 35,
'trend' => (float) 20.8,
'years' => (int) 1936
],
(int) 36 => [
'P' => (float) 20.8,
'Name' => (int) 36,
'trend' => (float) 20.8,
'years' => (int) 1937
],
(int) 37 => [
'P' => (float) 20.8,
'Name' => (int) 37,
'trend' => (float) 20.8,
'years' => (int) 1938
],
(int) 38 => [
'P' => (float) 20.8,
'Name' => (int) 38,
'trend' => (float) 20.8,
'years' => (int) 1939
],
(int) 39 => [
'P' => (float) 20.8,
'Name' => (int) 39,
'trend' => (float) 20.8,
'years' => (int) 1940
],
(int) 40 => [
'P' => (float) 20.8,
'Name' => (int) 40,
'trend' => (float) 20.8,
'years' => (int) 1941
],
(int) 41 => [
'P' => (float) 20.8,
'Name' => (int) 41,
'trend' => (float) 20.8,
'years' => (int) 1942
],
(int) 42 => [
'P' => (float) 20.8,
'Name' => (int) 42,
'trend' => (float) 20.8,
'years' => (int) 1943
],
(int) 43 => [
'P' => (float) 20.8,
'Name' => (int) 43,
'trend' => (float) 20.8,
'years' => (int) 1944
],
(int) 44 => [
'P' => (float) 20.8,
'Name' => (int) 44,
'trend' => (float) 20.8,
'years' => (int) 1945
],
(int) 45 => [
'P' => (float) 20.8,
'Name' => (int) 45,
'trend' => (float) 20.8,
'years' => (int) 1946
],
(int) 46 => [
'P' => (float) 20.8,
'Name' => (int) 46,
'trend' => (float) 20.8,
'years' => (int) 1947
],
(int) 47 => [
'P' => (float) 20.8,
'Name' => (int) 47,
'trend' => (float) 20.8,
'years' => (int) 1948
],
(int) 48 => [
'P' => (float) 20.8,
'Name' => (int) 48,
'trend' => (float) 20.8,
'years' => (int) 1949
],
(int) 49 => [
'P' => (float) 20.8,
'Name' => (int) 49,
'trend' => (float) 20.8,
'years' => (int) 1950
],
(int) 50 => [
'P' => (float) 20.8,
'Name' => (int) 50,
'trend' => (float) 20.8,
'years' => (int) 1951
],
(int) 51 => [
'P' => (float) 20.8,
'Name' => (int) 51,
'trend' => (float) 20.8,
'years' => (int) 1952
],
(int) 52 => [
'P' => (float) 20.8,
'Name' => (int) 52,
'trend' => (float) 20.8,
'years' => (int) 1953
],
(int) 53 => [
'P' => (float) 20.8,
'Name' => (int) 53,
'trend' => (float) 20.8,
'years' => (int) 1954
],
(int) 54 => [
'P' => (float) 20.8,
'Name' => (int) 54,
'trend' => (float) 20.8,
'years' => (int) 1955
],
(int) 55 => [
'P' => (float) 20.8,
'Name' => (int) 55,
'trend' => (float) 20.8,
'years' => (int) 1956
],
(int) 56 => [
'P' => (float) 20.8,
'Name' => (int) 56,
'trend' => (float) 20.8,
'years' => (int) 1957
],
(int) 57 => [
'P' => (float) 20.8,
'Name' => (int) 57,
'trend' => (float) 20.8,
'years' => (int) 1958
],
(int) 58 => [
'P' => (float) 20.8,
'Name' => (int) 58,
'trend' => (float) 20.8,
'years' => (int) 1959
],
(int) 59 => [
'P' => (float) 20.8,
'Name' => (int) 59,
'trend' => (float) 20.8,
'years' => (int) 1960
],
(int) 60 => [
'P' => (float) 20.8,
'Name' => (int) 60,
'trend' => (float) 20.8,
'years' => (int) 1961
],
(int) 61 => [
'P' => (float) 20.8,
'Name' => (int) 61,
'trend' => (float) 20.8,
'years' => (int) 1962
],
(int) 62 => [
'P' => (float) 20.8,
'Name' => (int) 62,
'trend' => (float) 20.8,
'years' => (int) 1963
],
(int) 63 => [
'P' => (float) 20.8,
'Name' => (int) 63,
'trend' => (float) 20.8,
'years' => (int) 1964
],
(int) 64 => [
'P' => (float) 20.8,
'Name' => (int) 64,
'trend' => (float) 20.8,
'years' => (int) 1965
],
(int) 65 => [
'P' => (float) 20.8,
'Name' => (int) 65,
'trend' => (float) 20.8,
'years' => (int) 1966
],
(int) 66 => [
'P' => (float) 20.8,
'Name' => (int) 66,
'trend' => (float) 20.8,
'years' => (int) 1967
],
(int) 67 => [
'P' => (float) 20.8,
'Name' => (int) 67,
'trend' => (float) 20.8,
'years' => (int) 1968
],
(int) 68 => [
'P' => (float) 20.8,
'Name' => (int) 68,
'trend' => (float) 20.8,
'years' => (int) 1969
],
(int) 69 => [
'P' => (float) 20.8,
'Name' => (int) 69,
'trend' => (float) 20.8,
'years' => (int) 1970
],
(int) 70 => [
'P' => (float) 20.8,
'Name' => (int) 70,
'trend' => (float) 20.8,
'years' => (int) 1971
],
(int) 71 => [
'P' => (float) 20.8,
'Name' => (int) 71,
'trend' => (float) 20.8,
'years' => (int) 1972
],
(int) 72 => [
'P' => (float) 20.8,
'Name' => (int) 72,
'trend' => (float) 20.8,
'years' => (int) 1973
],
(int) 73 => [
'P' => (float) 20.8,
'Name' => (int) 73,
'trend' => (float) 20.8,
'years' => (int) 1974
],
(int) 74 => [
'P' => (float) 20.8,
'Name' => (int) 74,
'trend' => (float) 20.8,
'years' => (int) 1975
],
(int) 75 => [
'P' => (float) 20.8,
'Name' => (int) 75,
'trend' => (float) 20.8,
'years' => (int) 1976
],
(int) 76 => [
'P' => (float) 20.8,
'Name' => (int) 76,
'trend' => (float) 20.8,
'years' => (int) 1977
],
(int) 77 => [
'P' => (float) 20.8,
'Name' => (int) 77,
'trend' => (float) 20.8,
'years' => (int) 1978
],
(int) 78 => [
'P' => (float) 20.8,
'Name' => (int) 78,
'trend' => (float) 20.8,
'years' => (int) 1979
],
(int) 79 => [
'P' => (float) 20.8,
'Name' => (int) 79,
'trend' => (float) 20.8,
'years' => (int) 1980
],
(int) 80 => [
'P' => (float) 20.8,
'Name' => (int) 80,
'trend' => (float) 20.8,
'years' => (int) 1981
],
(int) 81 => [
'P' => (float) 20.8,
'Name' => (int) 81,
'trend' => (float) 20.8,
'years' => (int) 1982
],
(int) 82 => [
'P' => (float) 20.8,
'Name' => (int) 82,
'trend' => (float) 20.8,
'years' => (int) 1983
],
(int) 83 => [
'P' => (float) 20.8,
'Name' => (int) 83,
'trend' => (float) 20.8,
'years' => (int) 1984
],
(int) 84 => [
'P' => (float) 20.8,
'Name' => (int) 84,
'trend' => (float) 20.8,
'years' => (int) 1985
],
(int) 85 => [
'P' => (float) 20.8,
'Name' => (int) 85,
'trend' => (float) 20.8,
'years' => (int) 1986
],
(int) 86 => [
'P' => (float) 20.8,
'Name' => (int) 86,
'trend' => (float) 20.8,
'years' => (int) 1987
],
(int) 87 => [
'P' => (float) 20.8,
'Name' => (int) 87,
'trend' => (float) 20.8,
'years' => (int) 1988
],
(int) 88 => [
'P' => (float) 20.8,
'Name' => (int) 88,
'trend' => (float) 20.8,
'years' => (int) 1989
],
(int) 89 => [
'P' => (float) 20.8,
'Name' => (int) 89,
'trend' => (float) 20.8,
'years' => (int) 1990
],
(int) 90 => [
'P' => (float) 20.8,
'Name' => (int) 90,
'trend' => (float) 20.8,
'years' => (int) 1991
],
(int) 91 => [
'P' => (float) 20.8,
'Name' => (int) 91,
'trend' => (float) 20.8,
'years' => (int) 1992
],
(int) 92 => [
'P' => (float) 20.8,
'Name' => (int) 92,
'trend' => (float) 20.8,
'years' => (int) 1993
],
(int) 93 => [
'P' => (float) 20.8,
'Name' => (int) 93,
'trend' => (float) 20.8,
'years' => (int) 1994
],
(int) 94 => [
'P' => (float) 20.8,
'Name' => (int) 94,
'trend' => (float) 20.8,
'years' => (int) 1995
],
(int) 95 => [
'P' => (float) 20.8,
'Name' => (int) 95,
'trend' => (float) 20.8,
'years' => (int) 1996
],
(int) 96 => [
'P' => (float) 20.8,
'Name' => (int) 96,
'trend' => (float) 20.8,
'years' => (int) 1997
],
(int) 97 => [
'P' => (float) 20.8,
'Name' => (int) 97,
'trend' => (float) 20.8,
'years' => (int) 1998
],
(int) 98 => [
'P' => (float) 20.8,
'Name' => (int) 98,
'trend' => (float) 20.8,
'years' => (int) 1999
],
(int) 99 => [
'P' => (float) 20.8,
'Name' => (int) 99,
'trend' => false,
'years' => (int) 2000
],
(int) 100 => [
'P' => (float) 20.8,
'Name' => (int) 100,
'trend' => false,
'years' => (int) 2001
],
(int) 101 => [
'P' => (float) 20.8,
'Name' => (int) 101,
'trend' => false,
'years' => (int) 2002
],
(int) 102 => [
'P' => (float) 20.8,
'Name' => (int) 102,
'trend' => false,
'years' => (int) 2003
],
(int) 103 => [
'P' => (float) 20.8,
'Name' => (int) 103,
'trend' => false,
'years' => (int) 2004
],
(int) 104 => [
'P' => (float) 20.8,
'Name' => (int) 104,
'trend' => false,
'years' => (int) 2005
],
(int) 105 => [
'P' => (float) 20.8,
'Name' => (int) 105,
'trend' => false,
'years' => (int) 2006
],
(int) 106 => [
'P' => (float) 20.8,
'Name' => (int) 106,
'trend' => false,
'years' => (int) 2007
],
(int) 107 => [
'P' => (float) 20.8,
'Name' => (int) 107,
'trend' => false,
'years' => (int) 2008
],
(int) 108 => [
'P' => (float) 20.8,
'Name' => (int) 108,
'trend' => false,
'years' => (int) 2009
]
]
$DataDescription = [
'Position' => 'years',
'Format' => [
'X' => 'number',
'Y' => 'number'
],
'Unit' => [
'X' => null,
'Y' => ' cm'
],
'Values' => [
(int) 0 => 'P',
(int) 1 => 'trend'
],
'Description' => [
'P' => 'Precipitation',
'trend' => '20 Yr Trend'
],
'Axis' => [
'X' => 'Year',
'Y' => 'Precipitation'
]
]
$ScaleMode = (int) 1
$R = (int) 100
$G = (int) 100
$B = (int) 100
$DrawTicks = true
$Angle = (int) 0
$Decimals = (int) 0
$WithMargin = false
$SkipLabels = (int) 10
$RightScale = false
$C_TextColor = (int) 6579300
$Values = [
'P' => (float) 20.8,
'Name' => (int) 108,
'trend' => false,
'years' => (int) 2009
]
$Key = (int) 108
$ColName = 'trend'
$Key2 = (int) 1
$Value = false
$DataRange = (float) 0.2
$ScaleOk = true
$Factor = (float) 0.1
$MaxDivs = (float) 13.2
$Scale = (int) 1
$Divisions = (float) 0
$Scale1 = (float) 2
$Scale2 = (float) 1
$Scale4 = (float) 0.5
$YPos = (int) 360
$XMin = null
$i = (int) 1 pChart::drawScale() - ROOT/vendor/pchart/pchart/pchart.php, line 547
App\Controller\GeographicsController::_yrtotprecip() - APP/Controller/GeographicsController.php, line 443
App\Controller\GeographicsController::climate() - APP/Controller/GeographicsController.php, line 140
Cake\Controller\Controller::invokeAction() - CORE/src/Controller/Controller.php, line 609
Cake\Http\ActionDispatcher::_invoke() - CORE/src/Http/ActionDispatcher.php, line 120
Cake\Http\ActionDispatcher::dispatch() - CORE/src/Http/ActionDispatcher.php, line 94
Cake\Http\BaseApplication::__invoke() - CORE/src/Http/BaseApplication.php, line 235
Cake\Http\Runner::__invoke() - CORE/src/Http/Runner.php, line 65
Cake\Routing\Middleware\RoutingMiddleware::__invoke() - CORE/src/Routing/Middleware/RoutingMiddleware.php, line 156
Cake\Http\Runner::__invoke() - CORE/src/Http/Runner.php, line 65
Cake\Routing\Middleware\AssetMiddleware::__invoke() - CORE/src/Routing/Middleware/AssetMiddleware.php, line 88
Cake\Http\Runner::__invoke() - CORE/src/Http/Runner.php, line 65
Cake\Error\Middleware\ErrorHandlerMiddleware::__invoke() - CORE/src/Error/Middleware/ErrorHandlerMiddleware.php, line 98
Cake\Http\Runner::__invoke() - CORE/src/Http/Runner.php, line 65
Cake\Http\Runner::run() - CORE/src/Http/Runner.php, line 51
Cake\Http\Server::run() - CORE/src/Http/Server.php, line 98
[main] - ROOT/webroot/index.php, line 40 Warning (512)CORE/src/Http/ResponseEmitter.php , line 48 ]Code Context if ( Configure :: read ( 'debug' )) { trigger_error ( $message , E_USER_WARNING ); } else { $response = object(Cake\Http\Response) {
'status' => (int) 200,
'contentType' => 'text/html',
'headers' => [
'Content-Type' => [
[maximum depth reached]
]
],
'file' => null,
'fileRange' => [],
'cookies' => object(Cake\Http\Cookie\CookieCollection) {},
'cacheDirectives' => [],
'body' => '<!DOCTYPE html PUBLIC "-//W3C//DTD XHTML 1.0 Transitional//EN" "http://www.w3.org/TR/xhtml1/DTD/xhtml1-transitional.dtd">
<html xmlns="http://www.w3.org/1999/xhtml">
<head>
<meta charset="utf-8"/> <title>World Species : Climate Data for Latitude 71.25 Longitude 179.75</title>
<link href="/favicon.ico" type="image/x-icon" rel="icon"/><link href="/favicon.ico" type="image/x-icon" rel="shortcut icon"/> <meta name="description" content="Climate Data for Latitude 71.25 Longitude 179.75"/><meta name="keywords" content="species,taxonomy,endangered,invasive,longevity,geography,relationships,attributes,climate data,land use,emblem,ecoregion,protected area,ecosystem,animal cam"/> <link rel="stylesheet" href="/css/cake.generic.css"/> <script src="/js/prototype.js"></script>
</head>
<body>
<div id="container"> <div id="header">
<table width="100%"><tr>
<td width="33%"><form method="post" accept-charset="utf-8" id="SearchForm" onsubmit="this.action = "/taxas/search/" + this["Search[term]"].value" action="/taxas/search"><div style="display:none;"><input type="hidden" name="_method" value="POST"/></div><div class="input text"><label for="search-term">Search</label><img src="/img/info.png" border="0" title="Enter a common or scientific species name, ecoregion, protected area, country" alt=""/> <span style="vertical-align: top;"><a href="/indices/advanced">Advanced Search</a></span><br /><input type="text" name="Search[term]" size="15" accesskey="4" id="search-term"/></div><div class="submit"><input type="image" src="/img/go.png"/></div></form></td>
<td width="*" style="text-align:center"><a href="/" accesskey="1" style="text-decoration: none; font-size: 42px; font-weight: normal;">World Species</a> </td>
<td width="33%"><div align='right'>
<a href="/pages/help">Help</a> </div></td>
</tr></table>
<center>
<div id="mainmenu"><ul id="nav"><li style='border-right: 1px solid #000;border-left: 1px solid #000;'><a href="/">Home</a></li><li title="Display species by geographic area" style=''><a href="/geographics/menu">Geography</a></li><li class="downarrow" style="border-right: 1px solid #000;">↓<ul><li><a href="/azesites"><span class="ultooltip" title="Alliance for Zero Extinction">AZE</span> Sites</a></li><li><a href="/hotspots">Biodiversity Hotspots</a></li><li><a href="/geographics/climatemap">Climate Data</a></li><li><a href="/ecoregions">Ecoregions</a></li><li><a href="/vegclasses">Habitat Vegetation Classification</a></li><li><a href="/birdareas">Important Bird Areas</a></li><li><a href="/irreplacables">Irreplacable Areas</a></li><li><a href="/geographics/landusemap">Land Use</a></li><li><a href="/protectareas">Protected Areas</a></li></ul></li><li title="Display species by ecosystem" style=''><a href="/ecosystems">Ecosystems</a></li><li class="downarrow" style="border-right: 1px solid #000;">↓<ul><li><a href="/ecosystems/display/4">African Grasslands</a></li><li><a href="/ecosystems/display/7">Alaska Forest</a></li><li><a href="/ecosystems/display/6">Alaska Tundra</a></li><li><a href="/ecosystems/display/3">Antarctica</a></li><li><a href="/ecosystems/display/5">Australian Grasslands</a></li><li><a href="/ecosystems/display/10"><span class="ultooltip" title="Belgium">Commanster</span></a></li><li><a href="/ecosystems/display/2">Coral Reef</a></li><li><a href="/ecosystems/display/8">Lake Michigan</a></li><li><a href="/ecosystems/display/11">Namib Desert</a></li><li><a href="/ecosystems/display/1">Northern Virginia</a></li><li><a href="/ecosystems/display/9">Rain Forest</a></li><li><a href="/ecosystems">More ...</a></li></ul></li><li title="Display species by topic" style=''><a href="/pages/lists">Lists</a></li><li class="downarrow" style="border-right: 1px solid #000;">↓<ul><li><a href="/webcams/wall">Animal Cams</a></li><li><a href="/audios">Animal Sounds</a></li><li><a href="/indices/cannibals">Cannibals</a></li><li><a href="/indices">Common Species</a></li><li><a href="/edges"><span class="ultooltip" title="Uniqueness & Vulnerability">EDGE Analysis</span></a></li><li><a href="/emblems">Emblems</a></li><li><a href="/endangereds">Endangered Species</a></li><li><a href="/invasives">Invasive Species</a></li><li><a href="/indices/raptors">Raptor Priority</a></li><li><a href="/pages/top100">Top 100 Endangered Species</a></li></ul></li><li style='border-right: 1px solid #000;'><a href="/pages/glossary">Glossary</a></li><li style='border-right: 1px solid #000;'><a href="/pages/about">About</a></li></ul> </div></center>
</div>
<div id="content"><center><table class="tabnoborder"><tr><td>
<div class="container clearfix">
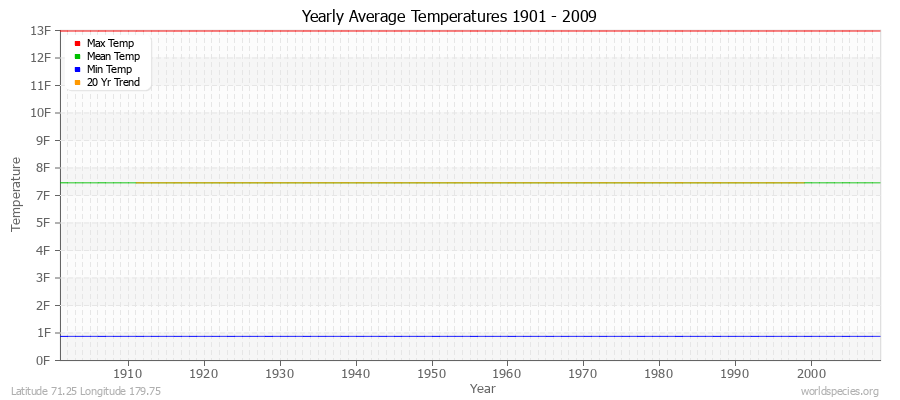
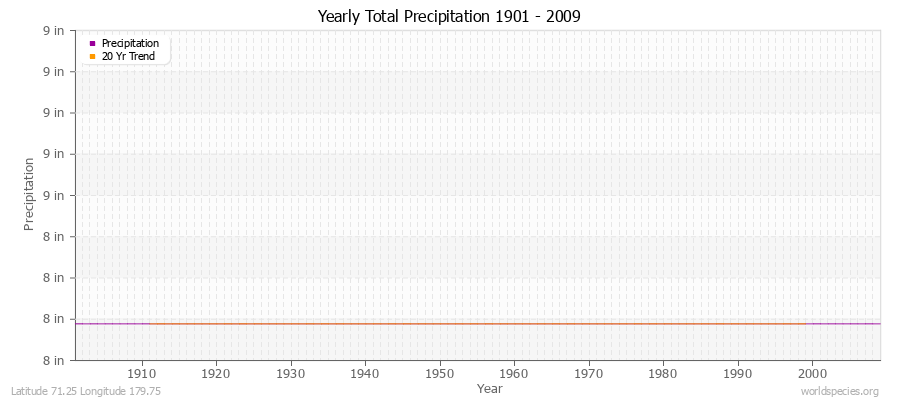
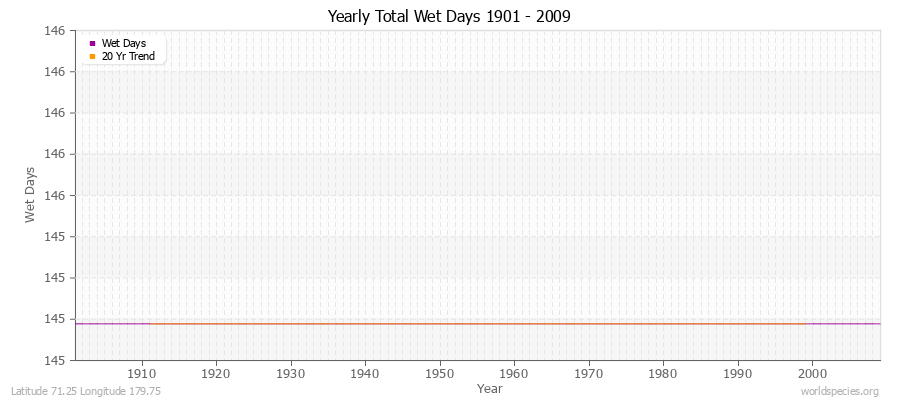
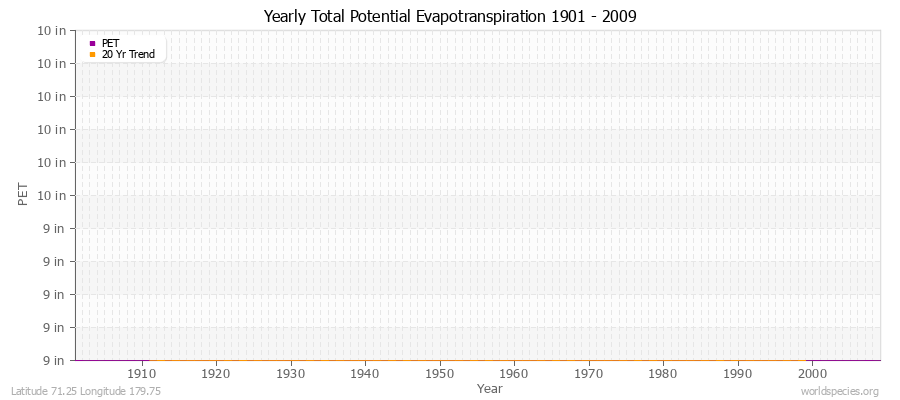
<h1>Climate Data for Latitude 71.25 Longitude 179.75</h1><b>Köppen climate classification</b>: ET (Climate: polar; Temperature: polar tundra)<table class="tabnoborder" width="99%"><tr><td width="20%"> </td><td width="*"><h2>Locations</h2></td><td width ="20%" style="vertical-align:middle;"><a href="/geographics/exportclimate/720/323">Download</a></td></tr></table><div><span style="border: 4px outset; padding:0 1px"><a href="https://maps.google.com?t=h&z=10&ll=71.25,179.75" title="View Google Map" style="text-decoration:none" class="external"><img src="/img/earth-icon.gif" style="vertical-align:middle;" alt=""/> Map</a></span></div><center><table class="tabnoborder"><tr><td style="text-align: left;">Wrangel island<br /></td></tr></table></center><div id="avg100met" style="display: none;"><h2>Averages (Metric) <a href="#" onclick="$('avg100eng').toggle(); $('avg100met').toggle(); return false;">English</a></h2><center><table class="tabnoborder"><thead><tr><th>Type</th><th>Units</th><th>Jan</th><th>Feb</th><th>Mar</th><th>Apr</th><th>May</th><th>Jun</th><th>Jul</th><th>Aug</th><th>Sep</th><th>Oct</th><th>Nov</th><th>Dec</th><th>Period</th></tr></thead><tbody><tr><td style='text-align: left;'>Min Temp</td><td>C°</td><td style="text-align: right;">-30.5</td><td style="text-align: right;">-33.1</td><td style="text-align: right;">-31.5</td><td style="text-align: right;">-25.6</td><td style="text-align: right;">-11.8</td><td style="text-align: right;">-2.7</td><td style="text-align: right;">-0.2</td><td style="text-align: right;">-1<span class="noshow">.0</span></td><td style="text-align: right;">-4.5</td><td style="text-align: right;">-14.5</td><td style="text-align: right;">-22.6</td><td style="text-align: right;">-29<span class="noshow">.0</span></td><td>109 years</td></tr><tr><td style='text-align: left;'>Mean Temp</td><td>C°</td><td style="text-align: right;">-26.5</td><td style="text-align: right;">-29.1</td><td style="text-align: right;">-27.4</td><td style="text-align: right;">-21.2</td><td style="text-align: right;">-8.7</td><td style="text-align: right;">0.1</td><td style="text-align: right;">2.9</td><td style="text-align: right;">1.8</td><td style="text-align: right;">-2.3</td><td style="text-align: right;">-11.6</td><td style="text-align: right;">-19.3</td><td style="text-align: right;">-25.4</td><td>109 years</td></tr><tr><td style='text-align: left;'>Max Temp</td><td>C°</td><td style="text-align: right;">-22.5</td><td style="text-align: right;">-25.1</td><td style="text-align: right;">-23.4</td><td style="text-align: right;">-16.9</td><td style="text-align: right;">-5.7</td><td style="text-align: right;">2.9</td><td style="text-align: right;">6<span class="noshow">.0</span></td><td style="text-align: right;">4.6</td><td style="text-align: right;">-0.1</td><td style="text-align: right;">-8.8</td><td style="text-align: right;">-16<span class="noshow">.0</span></td><td style="text-align: right;">-21.8</td><td>109 years</td></tr><tr><td style='text-align: left;'>Frost</td><td>Days</td><td style="text-align: right;">31<span class="noshow">.0</span></td><td style="text-align: right;">28.2</td><td style="text-align: right;">31<span class="noshow">.0</span></td><td style="text-align: right;">30<span class="noshow">.0</span></td><td style="text-align: right;">31<span class="noshow">.0</span></td><td style="text-align: right;">30<span class="noshow">.0</span></td><td style="text-align: right;">19.9</td><td style="text-align: right;">26.2</td><td style="text-align: right;">30<span class="noshow">.0</span></td><td style="text-align: right;">31<span class="noshow">.0</span></td><td style="text-align: right;">30<span class="noshow">.0</span></td><td style="text-align: right;">31<span class="noshow">.0</span></td><td>109 years</td></tr><tr><td style='text-align: left;'>Wet</td><td>Days</td><td style="text-align: right;">14<span class="noshow">.0</span></td><td style="text-align: right;">8<span class="noshow">.0</span></td><td style="text-align: right;">8<span class="noshow">.0</span></td><td style="text-align: right;">9<span class="noshow">.0</span></td><td style="text-align: right;">11<span class="noshow">.0</span></td><td style="text-align: right;">11.1</td><td style="text-align: right;">13.5</td><td style="text-align: right;">16.2</td><td style="text-align: right;">15.6</td><td style="text-align: right;">15.5</td><td style="text-align: right;">14.3</td><td style="text-align: right;">9<span class="noshow">.0</span></td><td>109 years</td></tr><tr><td style='text-align: left;'>Precipitation</td><td>mm</td><td style="text-align: right;">17<span class="noshow">.0</span></td><td style="text-align: right;">8<span class="noshow">.0</span></td><td style="text-align: right;">8<span class="noshow">.0</span></td><td style="text-align: right;">9<span class="noshow">.0</span></td><td style="text-align: right;">11<span class="noshow">.0</span></td><td style="text-align: right;">17<span class="noshow">.0</span></td><td style="text-align: right;">30<span class="noshow">.0</span></td><td style="text-align: right;">34<span class="noshow">.0</span></td><td style="text-align: right;">26<span class="noshow">.0</span></td><td style="text-align: right;">18<span class="noshow">.0</span></td><td style="text-align: right;">21<span class="noshow">.0</span></td><td style="text-align: right;">9<span class="noshow">.0</span></td><td>109 years</td></tr><tr><td style='text-align: left;'>Potential Evapotranspiration</td><td>mm</td><td style="text-align: right;">3.1</td><td style="text-align: right;">5.6</td><td style="text-align: right;">9.3</td><td style="text-align: right;">12<span class="noshow">.0</span></td><td style="text-align: right;">24.8</td><td style="text-align: right;">45<span class="noshow">.0</span></td><td style="text-align: right;">52.7</td><td style="text-align: right;">34.1</td><td style="text-align: right;">21<span class="noshow">.0</span></td><td style="text-align: right;">9.3</td><td style="text-align: right;">6<span class="noshow">.0</span></td><td style="text-align: right;">6.2</td><td>109 years</td></tr></tbody></table></center><div><img src="/climate/720_323_yravgtempmet.png" alt="Yearly Average Temperatures 2010 - 2009 (Metric) Latitude 71.25 Longitude 179.75" /></div><div><img src="/climate/720_323_yrmthmeanmet.png" alt="Monthly Mean Temperatures 1901 - 2009 (Metric) Latitude 71.25 Longitude 179.75" /></div><div><img src="/climate/720_323_yrtotfrost.png" alt="Yearly Total Frost Days 1901 - 2009 Latitude 71.25 Longitude 179.75" /></div><div><img src="/climate/720_323_yrtotprecipmet.png" alt="Yearly Total Precipitation 1901 - 2009 (Metric) Latitude 71.25 Longitude 179.75" /></div><div><img src="/climate/720_323_yrtotwet.png" alt="Yearly Total Wet Days 1901 - 2009 Latitude 71.25 Longitude 179.75" /></div><div><img src="/climate/720_323_yrtotpetmet.png" alt="Yearly Total Potential Evapotranspiration 1901 - 2009 (Metric) Latitude 71.25 Longitude 179.75" /></div></div><div id="avg100eng" style="display: block;"><h2>Averages (English) <a href="#" onclick="$('avg100eng').toggle(); $('avg100met').toggle(); return false;">Metric</a></h2><center><table class="tabnoborder"><thead><tr><th>Type</th><th>Units</th><th>Jan</th><th>Feb</th><th>Mar</th><th>Apr</th><th>May</th><th>Jun</th><th>Jul</th><th>Aug</th><th>Sep</th><th>Oct</th><th>Nov</th><th>Dec</th><th>Period</th></tr></thead><tbody><tr><td style='text-align: left;'>Min Temp</td><td>F°</td><td style="text-align: right;">-22.9</td><td style="text-align: right;">-27.6</td><td style="text-align: right;">-24.7</td><td style="text-align: right;">-14.1</td><td style="text-align: right;">10.8</td><td style="text-align: right;">27.1</td><td style="text-align: right;">31.6</td><td style="text-align: right;">30.2</td><td style="text-align: right;">23.9</td><td style="text-align: right;">5.9</td><td style="text-align: right;">-8.7</td><td style="text-align: right;">-20.2</td><td>109 years</td></tr><tr><td style='text-align: left;'>Mean Temp</td><td>F°</td><td style="text-align: right;">-15.7</td><td style="text-align: right;">-20.4</td><td style="text-align: right;">-17.3</td><td style="text-align: right;">-6.2</td><td style="text-align: right;">16.3</td><td style="text-align: right;">32.2</td><td style="text-align: right;">37.2</td><td style="text-align: right;">35.2</td><td style="text-align: right;">27.9</td><td style="text-align: right;">11.1</td><td style="text-align: right;">-2.7</td><td style="text-align: right;">-13.7</td><td>109 years</td></tr><tr><td style='text-align: left;'>Max Temp</td><td>F°</td><td style="text-align: right;">-8.5</td><td style="text-align: right;">-13.2</td><td style="text-align: right;">-10.1</td><td style="text-align: right;">1.6</td><td style="text-align: right;">21.7</td><td style="text-align: right;">37.2</td><td style="text-align: right;">42.8</td><td style="text-align: right;">40.3</td><td style="text-align: right;">31.8</td><td style="text-align: right;">16.2</td><td style="text-align: right;">3.2</td><td style="text-align: right;">-7.2</td><td>109 years</td></tr><tr><td style='text-align: left;'>Frost</td><td>Days</td><td style="text-align: right;">31<span class="noshow">.0</span></td><td style="text-align: right;">28.2</td><td style="text-align: right;">31<span class="noshow">.0</span></td><td style="text-align: right;">30<span class="noshow">.0</span></td><td style="text-align: right;">31<span class="noshow">.0</span></td><td style="text-align: right;">30<span class="noshow">.0</span></td><td style="text-align: right;">19.9</td><td style="text-align: right;">26.2</td><td style="text-align: right;">30<span class="noshow">.0</span></td><td style="text-align: right;">31<span class="noshow">.0</span></td><td style="text-align: right;">30<span class="noshow">.0</span></td><td style="text-align: right;">31<span class="noshow">.0</span></td><td>109 years</td></tr><tr><td style='text-align: left;'>Wet</td><td>Days</td><td style="text-align: right;">14<span class="noshow">.0</span></td><td style="text-align: right;">8<span class="noshow">.0</span></td><td style="text-align: right;">8<span class="noshow">.0</span></td><td style="text-align: right;">9<span class="noshow">.0</span></td><td style="text-align: right;">11<span class="noshow">.0</span></td><td style="text-align: right;">11.1</td><td style="text-align: right;">13.5</td><td style="text-align: right;">16.2</td><td style="text-align: right;">15.6</td><td style="text-align: right;">15.5</td><td style="text-align: right;">14.3</td><td style="text-align: right;">9<span class="noshow">.0</span></td><td>109 years</td></tr><tr><td style='text-align: left;'>Precipitation</td><td>in</td><td style="text-align: right;">0.7</td><td style="text-align: right;">0.3</td><td style="text-align: right;">0.3</td><td style="text-align: right;">0.4</td><td style="text-align: right;">0.4</td><td style="text-align: right;">0.7</td><td style="text-align: right;">1.2</td><td style="text-align: right;">1.3</td><td style="text-align: right;">1<span class="noshow">.0</span></td><td style="text-align: right;">0.7</td><td style="text-align: right;">0.8</td><td style="text-align: right;">0.4</td><td>109 years</td></tr><tr><td style='text-align: left;'>Potential Evapotranspiration</td><td>in</td><td style="text-align: right;">0.1</td><td style="text-align: right;">0.2</td><td style="text-align: right;">0.4</td><td style="text-align: right;">0.5</td><td style="text-align: right;">1<span class="noshow">.0</span></td><td style="text-align: right;">1.8</td><td style="text-align: right;">2.1</td><td style="text-align: right;">1.3</td><td style="text-align: right;">0.8</td><td style="text-align: right;">0.4</td><td style="text-align: right;">0.2</td><td style="text-align: right;">0.2</td><td>109 years</td></tr></tbody></table></center><div><img src="/climate/720_323_yravgtempeng.png" alt="Yearly Average Temperatures 2010 - 2009 (English) Latitude 71.25 Longitude 179.75" /></div><div><img src="/climate/720_323_yrmthmeaneng.png" alt="Monthly Mean Temperatures 1901 - 2009 (English) Latitude 71.25 Longitude 179.75" /></div><div><img src="/climate/720_323_yrtotfrost.png" alt="Yearly Total Frost Days 1901 - 2009 Latitude 71.25 Longitude 179.75" /></div><div><img src="/climate/720_323_yrtotprecipeng.png" alt="Yearly Total Precipitation 1901 - 2009 (English) Latitude 71.25 Longitude 179.75" /></div><div><img src="/climate/720_323_yrtotwet.png" alt="Yearly Total Wet Days 1901 - 2009 Latitude 71.25 Longitude 179.75" /></div><div><img src="/climate/720_323_yrtotpeteng.png" alt="Yearly Total Potential Evapotranspiration 1901 - 2009 (English) Latitude 71.25 Longitude 179.75" /></div></div><br />
<div style="text-align: left;">
<div class="citation">Climate data provided by <a href="http://badc.nerc.ac.uk/view/badc.nerc.ac.uk__ATOM__dataent_1256223773328276" class="external">CRU TS 3.1</a> - University of East Anglia Climate Research Unit (CRU). [Phil Jones, Ian Harris]. CRU Time Series (TS) high resolution gridded datasets, [Internet]. NCAS British Atmospheric Data Centre, 2008, Accessed: 28-July-2011</div><div class="citation">Charting software provided by <a href="http://pchart.sourceforge.net/index.php" class="external">pChart</a> - a PHP class to build charts.</div><div class="citation">Köppen climate classification provided by Kottek, M., J. Grieser, C. Beck, B. Rudolf, and F. Rubel, <a href="http://koeppen-geiger.vu-wien.ac.at/present.htm" class="external">2006: World Map of Köppen-Geiger Climate Classification updated</a>. Meteorol. Z., 15, 259-263</div><div class="citation">The calculation method for the potential evapotranspiration is the FAO grass reference equation (Ekstrom et al., 2007, which is based on Allen et al., 1994).
It is a variant of the Penman Monteith method using TMP, TMN, TMX, VAP, CLD.</div>
</div>
</div>
</td></tr></table></center></div>
<div id="footer">
<table width="100%"><tr>
<td width="30%" align="left">
</td>
<td width="*">
<a accesskey="9" style="text-decoration: none" href="mailto:species@brucemyers.com">Email</a>
</td>
<td width="30%">
© WorldSpecies.org 2020-2023
</td>
</tr></table>
</div>
</div>
</body>
</html>
'
}
$maxBufferLength = (int) 8192
$file = '/var/www/projects/species/vendor/cakephp/cakephp/src/Error/Debugger.php'
$line = (int) 853
$message = 'Unable to emit headers. Headers sent in file=/var/www/projects/species/vendor/cakephp/cakephp/src/Error/Debugger.php line=853' Cake\Http\ResponseEmitter::emit() - CORE/src/Http/ResponseEmitter.php, line 48
Cake\Http\Server::emit() - CORE/src/Http/Server.php, line 141
[main] - ROOT/webroot/index.php, line 40 Warning (2)CORE/src/Http/ResponseEmitter.php , line 148 ]Code Context $response -> getStatusCode (), ( $reasonPhrase ? ' ' . $reasonPhrase : '' ) )); $response = object(Cake\Http\Response) {
'status' => (int) 200,
'contentType' => 'text/html',
'headers' => [
'Content-Type' => [
[maximum depth reached]
]
],
'file' => null,
'fileRange' => [],
'cookies' => object(Cake\Http\Cookie\CookieCollection) {},
'cacheDirectives' => [],
'body' => '<!DOCTYPE html PUBLIC "-//W3C//DTD XHTML 1.0 Transitional//EN" "http://www.w3.org/TR/xhtml1/DTD/xhtml1-transitional.dtd">
<html xmlns="http://www.w3.org/1999/xhtml">
<head>
<meta charset="utf-8"/> <title>World Species : Climate Data for Latitude 71.25 Longitude 179.75</title>
<link href="/favicon.ico" type="image/x-icon" rel="icon"/><link href="/favicon.ico" type="image/x-icon" rel="shortcut icon"/> <meta name="description" content="Climate Data for Latitude 71.25 Longitude 179.75"/><meta name="keywords" content="species,taxonomy,endangered,invasive,longevity,geography,relationships,attributes,climate data,land use,emblem,ecoregion,protected area,ecosystem,animal cam"/> <link rel="stylesheet" href="/css/cake.generic.css"/> <script src="/js/prototype.js"></script>
</head>
<body>
<div id="container"> <div id="header">
<table width="100%"><tr>
<td width="33%"><form method="post" accept-charset="utf-8" id="SearchForm" onsubmit="this.action = "/taxas/search/" + this["Search[term]"].value" action="/taxas/search"><div style="display:none;"><input type="hidden" name="_method" value="POST"/></div><div class="input text"><label for="search-term">Search</label><img src="/img/info.png" border="0" title="Enter a common or scientific species name, ecoregion, protected area, country" alt=""/> <span style="vertical-align: top;"><a href="/indices/advanced">Advanced Search</a></span><br /><input type="text" name="Search[term]" size="15" accesskey="4" id="search-term"/></div><div class="submit"><input type="image" src="/img/go.png"/></div></form></td>
<td width="*" style="text-align:center"><a href="/" accesskey="1" style="text-decoration: none; font-size: 42px; font-weight: normal;">World Species</a> </td>
<td width="33%"><div align='right'>
<a href="/pages/help">Help</a> </div></td>
</tr></table>
<center>
<div id="mainmenu"><ul id="nav"><li style='border-right: 1px solid #000;border-left: 1px solid #000;'><a href="/">Home</a></li><li title="Display species by geographic area" style=''><a href="/geographics/menu">Geography</a></li><li class="downarrow" style="border-right: 1px solid #000;">↓<ul><li><a href="/azesites"><span class="ultooltip" title="Alliance for Zero Extinction">AZE</span> Sites</a></li><li><a href="/hotspots">Biodiversity Hotspots</a></li><li><a href="/geographics/climatemap">Climate Data</a></li><li><a href="/ecoregions">Ecoregions</a></li><li><a href="/vegclasses">Habitat Vegetation Classification</a></li><li><a href="/birdareas">Important Bird Areas</a></li><li><a href="/irreplacables">Irreplacable Areas</a></li><li><a href="/geographics/landusemap">Land Use</a></li><li><a href="/protectareas">Protected Areas</a></li></ul></li><li title="Display species by ecosystem" style=''><a href="/ecosystems">Ecosystems</a></li><li class="downarrow" style="border-right: 1px solid #000;">↓<ul><li><a href="/ecosystems/display/4">African Grasslands</a></li><li><a href="/ecosystems/display/7">Alaska Forest</a></li><li><a href="/ecosystems/display/6">Alaska Tundra</a></li><li><a href="/ecosystems/display/3">Antarctica</a></li><li><a href="/ecosystems/display/5">Australian Grasslands</a></li><li><a href="/ecosystems/display/10"><span class="ultooltip" title="Belgium">Commanster</span></a></li><li><a href="/ecosystems/display/2">Coral Reef</a></li><li><a href="/ecosystems/display/8">Lake Michigan</a></li><li><a href="/ecosystems/display/11">Namib Desert</a></li><li><a href="/ecosystems/display/1">Northern Virginia</a></li><li><a href="/ecosystems/display/9">Rain Forest</a></li><li><a href="/ecosystems">More ...</a></li></ul></li><li title="Display species by topic" style=''><a href="/pages/lists">Lists</a></li><li class="downarrow" style="border-right: 1px solid #000;">↓<ul><li><a href="/webcams/wall">Animal Cams</a></li><li><a href="/audios">Animal Sounds</a></li><li><a href="/indices/cannibals">Cannibals</a></li><li><a href="/indices">Common Species</a></li><li><a href="/edges"><span class="ultooltip" title="Uniqueness & Vulnerability">EDGE Analysis</span></a></li><li><a href="/emblems">Emblems</a></li><li><a href="/endangereds">Endangered Species</a></li><li><a href="/invasives">Invasive Species</a></li><li><a href="/indices/raptors">Raptor Priority</a></li><li><a href="/pages/top100">Top 100 Endangered Species</a></li></ul></li><li style='border-right: 1px solid #000;'><a href="/pages/glossary">Glossary</a></li><li style='border-right: 1px solid #000;'><a href="/pages/about">About</a></li></ul> </div></center>
</div>
<div id="content"><center><table class="tabnoborder"><tr><td>
<div class="container clearfix">
<h1>Climate Data for Latitude 71.25 Longitude 179.75</h1><b>Köppen climate classification</b>: ET (Climate: polar; Temperature: polar tundra)<table class="tabnoborder" width="99%"><tr><td width="20%"> </td><td width="*"><h2>Locations</h2></td><td width ="20%" style="vertical-align:middle;"><a href="/geographics/exportclimate/720/323">Download</a></td></tr></table><div><span style="border: 4px outset; padding:0 1px"><a href="https://maps.google.com?t=h&z=10&ll=71.25,179.75" title="View Google Map" style="text-decoration:none" class="external"><img src="/img/earth-icon.gif" style="vertical-align:middle;" alt=""/> Map</a></span></div><center><table class="tabnoborder"><tr><td style="text-align: left;">Wrangel island<br /></td></tr></table></center><div id="avg100met" style="display: none;"><h2>Averages (Metric) <a href="#" onclick="$('avg100eng').toggle(); $('avg100met').toggle(); return false;">English</a></h2><center><table class="tabnoborder"><thead><tr><th>Type</th><th>Units</th><th>Jan</th><th>Feb</th><th>Mar</th><th>Apr</th><th>May</th><th>Jun</th><th>Jul</th><th>Aug</th><th>Sep</th><th>Oct</th><th>Nov</th><th>Dec</th><th>Period</th></tr></thead><tbody><tr><td style='text-align: left;'>Min Temp</td><td>C°</td><td style="text-align: right;">-30.5</td><td style="text-align: right;">-33.1</td><td style="text-align: right;">-31.5</td><td style="text-align: right;">-25.6</td><td style="text-align: right;">-11.8</td><td style="text-align: right;">-2.7</td><td style="text-align: right;">-0.2</td><td style="text-align: right;">-1<span class="noshow">.0</span></td><td style="text-align: right;">-4.5</td><td style="text-align: right;">-14.5</td><td style="text-align: right;">-22.6</td><td style="text-align: right;">-29<span class="noshow">.0</span></td><td>109 years</td></tr><tr><td style='text-align: left;'>Mean Temp</td><td>C°</td><td style="text-align: right;">-26.5</td><td style="text-align: right;">-29.1</td><td style="text-align: right;">-27.4</td><td style="text-align: right;">-21.2</td><td style="text-align: right;">-8.7</td><td style="text-align: right;">0.1</td><td style="text-align: right;">2.9</td><td style="text-align: right;">1.8</td><td style="text-align: right;">-2.3</td><td style="text-align: right;">-11.6</td><td style="text-align: right;">-19.3</td><td style="text-align: right;">-25.4</td><td>109 years</td></tr><tr><td style='text-align: left;'>Max Temp</td><td>C°</td><td style="text-align: right;">-22.5</td><td style="text-align: right;">-25.1</td><td style="text-align: right;">-23.4</td><td style="text-align: right;">-16.9</td><td style="text-align: right;">-5.7</td><td style="text-align: right;">2.9</td><td style="text-align: right;">6<span class="noshow">.0</span></td><td style="text-align: right;">4.6</td><td style="text-align: right;">-0.1</td><td style="text-align: right;">-8.8</td><td style="text-align: right;">-16<span class="noshow">.0</span></td><td style="text-align: right;">-21.8</td><td>109 years</td></tr><tr><td style='text-align: left;'>Frost</td><td>Days</td><td style="text-align: right;">31<span class="noshow">.0</span></td><td style="text-align: right;">28.2</td><td style="text-align: right;">31<span class="noshow">.0</span></td><td style="text-align: right;">30<span class="noshow">.0</span></td><td style="text-align: right;">31<span class="noshow">.0</span></td><td style="text-align: right;">30<span class="noshow">.0</span></td><td style="text-align: right;">19.9</td><td style="text-align: right;">26.2</td><td style="text-align: right;">30<span class="noshow">.0</span></td><td style="text-align: right;">31<span class="noshow">.0</span></td><td style="text-align: right;">30<span class="noshow">.0</span></td><td style="text-align: right;">31<span class="noshow">.0</span></td><td>109 years</td></tr><tr><td style='text-align: left;'>Wet</td><td>Days</td><td style="text-align: right;">14<span class="noshow">.0</span></td><td style="text-align: right;">8<span class="noshow">.0</span></td><td style="text-align: right;">8<span class="noshow">.0</span></td><td style="text-align: right;">9<span class="noshow">.0</span></td><td style="text-align: right;">11<span class="noshow">.0</span></td><td style="text-align: right;">11.1</td><td style="text-align: right;">13.5</td><td style="text-align: right;">16.2</td><td style="text-align: right;">15.6</td><td style="text-align: right;">15.5</td><td style="text-align: right;">14.3</td><td style="text-align: right;">9<span class="noshow">.0</span></td><td>109 years</td></tr><tr><td style='text-align: left;'>Precipitation</td><td>mm</td><td style="text-align: right;">17<span class="noshow">.0</span></td><td style="text-align: right;">8<span class="noshow">.0</span></td><td style="text-align: right;">8<span class="noshow">.0</span></td><td style="text-align: right;">9<span class="noshow">.0</span></td><td style="text-align: right;">11<span class="noshow">.0</span></td><td style="text-align: right;">17<span class="noshow">.0</span></td><td style="text-align: right;">30<span class="noshow">.0</span></td><td style="text-align: right;">34<span class="noshow">.0</span></td><td style="text-align: right;">26<span class="noshow">.0</span></td><td style="text-align: right;">18<span class="noshow">.0</span></td><td style="text-align: right;">21<span class="noshow">.0</span></td><td style="text-align: right;">9<span class="noshow">.0</span></td><td>109 years</td></tr><tr><td style='text-align: left;'>Potential Evapotranspiration</td><td>mm</td><td style="text-align: right;">3.1</td><td style="text-align: right;">5.6</td><td style="text-align: right;">9.3</td><td style="text-align: right;">12<span class="noshow">.0</span></td><td style="text-align: right;">24.8</td><td style="text-align: right;">45<span class="noshow">.0</span></td><td style="text-align: right;">52.7</td><td style="text-align: right;">34.1</td><td style="text-align: right;">21<span class="noshow">.0</span></td><td style="text-align: right;">9.3</td><td style="text-align: right;">6<span class="noshow">.0</span></td><td style="text-align: right;">6.2</td><td>109 years</td></tr></tbody></table></center><div><img src="/climate/720_323_yravgtempmet.png" alt="Yearly Average Temperatures 2010 - 2009 (Metric) Latitude 71.25 Longitude 179.75" /></div><div><img src="/climate/720_323_yrmthmeanmet.png" alt="Monthly Mean Temperatures 1901 - 2009 (Metric) Latitude 71.25 Longitude 179.75" /></div><div><img src="/climate/720_323_yrtotfrost.png" alt="Yearly Total Frost Days 1901 - 2009 Latitude 71.25 Longitude 179.75" /></div><div><img src="/climate/720_323_yrtotprecipmet.png" alt="Yearly Total Precipitation 1901 - 2009 (Metric) Latitude 71.25 Longitude 179.75" /></div><div><img src="/climate/720_323_yrtotwet.png" alt="Yearly Total Wet Days 1901 - 2009 Latitude 71.25 Longitude 179.75" /></div><div><img src="/climate/720_323_yrtotpetmet.png" alt="Yearly Total Potential Evapotranspiration 1901 - 2009 (Metric) Latitude 71.25 Longitude 179.75" /></div></div><div id="avg100eng" style="display: block;"><h2>Averages (English) <a href="#" onclick="$('avg100eng').toggle(); $('avg100met').toggle(); return false;">Metric</a></h2><center><table class="tabnoborder"><thead><tr><th>Type</th><th>Units</th><th>Jan</th><th>Feb</th><th>Mar</th><th>Apr</th><th>May</th><th>Jun</th><th>Jul</th><th>Aug</th><th>Sep</th><th>Oct</th><th>Nov</th><th>Dec</th><th>Period</th></tr></thead><tbody><tr><td style='text-align: left;'>Min Temp</td><td>F°</td><td style="text-align: right;">-22.9</td><td style="text-align: right;">-27.6</td><td style="text-align: right;">-24.7</td><td style="text-align: right;">-14.1</td><td style="text-align: right;">10.8</td><td style="text-align: right;">27.1</td><td style="text-align: right;">31.6</td><td style="text-align: right;">30.2</td><td style="text-align: right;">23.9</td><td style="text-align: right;">5.9</td><td style="text-align: right;">-8.7</td><td style="text-align: right;">-20.2</td><td>109 years</td></tr><tr><td style='text-align: left;'>Mean Temp</td><td>F°</td><td style="text-align: right;">-15.7</td><td style="text-align: right;">-20.4</td><td style="text-align: right;">-17.3</td><td style="text-align: right;">-6.2</td><td style="text-align: right;">16.3</td><td style="text-align: right;">32.2</td><td style="text-align: right;">37.2</td><td style="text-align: right;">35.2</td><td style="text-align: right;">27.9</td><td style="text-align: right;">11.1</td><td style="text-align: right;">-2.7</td><td style="text-align: right;">-13.7</td><td>109 years</td></tr><tr><td style='text-align: left;'>Max Temp</td><td>F°</td><td style="text-align: right;">-8.5</td><td style="text-align: right;">-13.2</td><td style="text-align: right;">-10.1</td><td style="text-align: right;">1.6</td><td style="text-align: right;">21.7</td><td style="text-align: right;">37.2</td><td style="text-align: right;">42.8</td><td style="text-align: right;">40.3</td><td style="text-align: right;">31.8</td><td style="text-align: right;">16.2</td><td style="text-align: right;">3.2</td><td style="text-align: right;">-7.2</td><td>109 years</td></tr><tr><td style='text-align: left;'>Frost</td><td>Days</td><td style="text-align: right;">31<span class="noshow">.0</span></td><td style="text-align: right;">28.2</td><td style="text-align: right;">31<span class="noshow">.0</span></td><td style="text-align: right;">30<span class="noshow">.0</span></td><td style="text-align: right;">31<span class="noshow">.0</span></td><td style="text-align: right;">30<span class="noshow">.0</span></td><td style="text-align: right;">19.9</td><td style="text-align: right;">26.2</td><td style="text-align: right;">30<span class="noshow">.0</span></td><td style="text-align: right;">31<span class="noshow">.0</span></td><td style="text-align: right;">30<span class="noshow">.0</span></td><td style="text-align: right;">31<span class="noshow">.0</span></td><td>109 years</td></tr><tr><td style='text-align: left;'>Wet</td><td>Days</td><td style="text-align: right;">14<span class="noshow">.0</span></td><td style="text-align: right;">8<span class="noshow">.0</span></td><td style="text-align: right;">8<span class="noshow">.0</span></td><td style="text-align: right;">9<span class="noshow">.0</span></td><td style="text-align: right;">11<span class="noshow">.0</span></td><td style="text-align: right;">11.1</td><td style="text-align: right;">13.5</td><td style="text-align: right;">16.2</td><td style="text-align: right;">15.6</td><td style="text-align: right;">15.5</td><td style="text-align: right;">14.3</td><td style="text-align: right;">9<span class="noshow">.0</span></td><td>109 years</td></tr><tr><td style='text-align: left;'>Precipitation</td><td>in</td><td style="text-align: right;">0.7</td><td style="text-align: right;">0.3</td><td style="text-align: right;">0.3</td><td style="text-align: right;">0.4</td><td style="text-align: right;">0.4</td><td style="text-align: right;">0.7</td><td style="text-align: right;">1.2</td><td style="text-align: right;">1.3</td><td style="text-align: right;">1<span class="noshow">.0</span></td><td style="text-align: right;">0.7</td><td style="text-align: right;">0.8</td><td style="text-align: right;">0.4</td><td>109 years</td></tr><tr><td style='text-align: left;'>Potential Evapotranspiration</td><td>in</td><td style="text-align: right;">0.1</td><td style="text-align: right;">0.2</td><td style="text-align: right;">0.4</td><td style="text-align: right;">0.5</td><td style="text-align: right;">1<span class="noshow">.0</span></td><td style="text-align: right;">1.8</td><td style="text-align: right;">2.1</td><td style="text-align: right;">1.3</td><td style="text-align: right;">0.8</td><td style="text-align: right;">0.4</td><td style="text-align: right;">0.2</td><td style="text-align: right;">0.2</td><td>109 years</td></tr></tbody></table></center><div><img src="/climate/720_323_yravgtempeng.png" alt="Yearly Average Temperatures 2010 - 2009 (English) Latitude 71.25 Longitude 179.75" /></div><div><img src="/climate/720_323_yrmthmeaneng.png" alt="Monthly Mean Temperatures 1901 - 2009 (English) Latitude 71.25 Longitude 179.75" /></div><div><img src="/climate/720_323_yrtotfrost.png" alt="Yearly Total Frost Days 1901 - 2009 Latitude 71.25 Longitude 179.75" /></div><div><img src="/climate/720_323_yrtotprecipeng.png" alt="Yearly Total Precipitation 1901 - 2009 (English) Latitude 71.25 Longitude 179.75" /></div><div><img src="/climate/720_323_yrtotwet.png" alt="Yearly Total Wet Days 1901 - 2009 Latitude 71.25 Longitude 179.75" /></div><div><img src="/climate/720_323_yrtotpeteng.png" alt="Yearly Total Potential Evapotranspiration 1901 - 2009 (English) Latitude 71.25 Longitude 179.75" /></div></div><br />
<div style="text-align: left;">
<div class="citation">Climate data provided by <a href="http://badc.nerc.ac.uk/view/badc.nerc.ac.uk__ATOM__dataent_1256223773328276" class="external">CRU TS 3.1</a> - University of East Anglia Climate Research Unit (CRU). [Phil Jones, Ian Harris]. CRU Time Series (TS) high resolution gridded datasets, [Internet]. NCAS British Atmospheric Data Centre, 2008, Accessed: 28-July-2011</div><div class="citation">Charting software provided by <a href="http://pchart.sourceforge.net/index.php" class="external">pChart</a> - a PHP class to build charts.</div><div class="citation">Köppen climate classification provided by Kottek, M., J. Grieser, C. Beck, B. Rudolf, and F. Rubel, <a href="http://koeppen-geiger.vu-wien.ac.at/present.htm" class="external">2006: World Map of Köppen-Geiger Climate Classification updated</a>. Meteorol. Z., 15, 259-263</div><div class="citation">The calculation method for the potential evapotranspiration is the FAO grass reference equation (Ekstrom et al., 2007, which is based on Allen et al., 1994).
It is a variant of the Penman Monteith method using TMP, TMN, TMX, VAP, CLD.</div>
</div>
</div>
</td></tr></table></center></div>
<div id="footer">
<table width="100%"><tr>
<td width="30%" align="left">
</td>
<td width="*">
<a accesskey="9" style="text-decoration: none" href="mailto:species@brucemyers.com">Email</a>
</td>
<td width="30%">
© WorldSpecies.org 2020-2023
</td>
</tr></table>
</div>
</div>
</body>
</html>
'
}
$reasonPhrase = 'OK' header - [internal], line ??
Cake\Http\ResponseEmitter::emitStatusLine() - CORE/src/Http/ResponseEmitter.php, line 148
Cake\Http\ResponseEmitter::emit() - CORE/src/Http/ResponseEmitter.php, line 54
Cake\Http\Server::emit() - CORE/src/Http/Server.php, line 141
[main] - ROOT/webroot/index.php, line 40 Warning (2)CORE/src/Http/ResponseEmitter.php , line 177 ]Code Context foreach ( $values as $value ) { header ( sprintf ( '%s: %s' , $response = object(Cake\Http\Response) {
'status' => (int) 200,
'contentType' => 'text/html',
'headers' => [
'Content-Type' => [
[maximum depth reached]
]
],
'file' => null,
'fileRange' => [],
'cookies' => object(Cake\Http\Cookie\CookieCollection) {},
'cacheDirectives' => [],
'body' => '<!DOCTYPE html PUBLIC "-//W3C//DTD XHTML 1.0 Transitional//EN" "http://www.w3.org/TR/xhtml1/DTD/xhtml1-transitional.dtd">
<html xmlns="http://www.w3.org/1999/xhtml">
<head>
<meta charset="utf-8"/> <title>World Species : Climate Data for Latitude 71.25 Longitude 179.75</title>
<link href="/favicon.ico" type="image/x-icon" rel="icon"/><link href="/favicon.ico" type="image/x-icon" rel="shortcut icon"/> <meta name="description" content="Climate Data for Latitude 71.25 Longitude 179.75"/><meta name="keywords" content="species,taxonomy,endangered,invasive,longevity,geography,relationships,attributes,climate data,land use,emblem,ecoregion,protected area,ecosystem,animal cam"/> <link rel="stylesheet" href="/css/cake.generic.css"/> <script src="/js/prototype.js"></script>
</head>
<body>
<div id="container"> <div id="header">
<table width="100%"><tr>
<td width="33%"><form method="post" accept-charset="utf-8" id="SearchForm" onsubmit="this.action = "/taxas/search/" + this["Search[term]"].value" action="/taxas/search"><div style="display:none;"><input type="hidden" name="_method" value="POST"/></div><div class="input text"><label for="search-term">Search</label><img src="/img/info.png" border="0" title="Enter a common or scientific species name, ecoregion, protected area, country" alt=""/> <span style="vertical-align: top;"><a href="/indices/advanced">Advanced Search</a></span><br /><input type="text" name="Search[term]" size="15" accesskey="4" id="search-term"/></div><div class="submit"><input type="image" src="/img/go.png"/></div></form></td>
<td width="*" style="text-align:center"><a href="/" accesskey="1" style="text-decoration: none; font-size: 42px; font-weight: normal;">World Species</a> </td>
<td width="33%"><div align='right'>
<a href="/pages/help">Help</a> </div></td>
</tr></table>
<center>
<div id="mainmenu"><ul id="nav"><li style='border-right: 1px solid #000;border-left: 1px solid #000;'><a href="/">Home</a></li><li title="Display species by geographic area" style=''><a href="/geographics/menu">Geography</a></li><li class="downarrow" style="border-right: 1px solid #000;">↓<ul><li><a href="/azesites"><span class="ultooltip" title="Alliance for Zero Extinction">AZE</span> Sites</a></li><li><a href="/hotspots">Biodiversity Hotspots</a></li><li><a href="/geographics/climatemap">Climate Data</a></li><li><a href="/ecoregions">Ecoregions</a></li><li><a href="/vegclasses">Habitat Vegetation Classification</a></li><li><a href="/birdareas">Important Bird Areas</a></li><li><a href="/irreplacables">Irreplacable Areas</a></li><li><a href="/geographics/landusemap">Land Use</a></li><li><a href="/protectareas">Protected Areas</a></li></ul></li><li title="Display species by ecosystem" style=''><a href="/ecosystems">Ecosystems</a></li><li class="downarrow" style="border-right: 1px solid #000;">↓<ul><li><a href="/ecosystems/display/4">African Grasslands</a></li><li><a href="/ecosystems/display/7">Alaska Forest</a></li><li><a href="/ecosystems/display/6">Alaska Tundra</a></li><li><a href="/ecosystems/display/3">Antarctica</a></li><li><a href="/ecosystems/display/5">Australian Grasslands</a></li><li><a href="/ecosystems/display/10"><span class="ultooltip" title="Belgium">Commanster</span></a></li><li><a href="/ecosystems/display/2">Coral Reef</a></li><li><a href="/ecosystems/display/8">Lake Michigan</a></li><li><a href="/ecosystems/display/11">Namib Desert</a></li><li><a href="/ecosystems/display/1">Northern Virginia</a></li><li><a href="/ecosystems/display/9">Rain Forest</a></li><li><a href="/ecosystems">More ...</a></li></ul></li><li title="Display species by topic" style=''><a href="/pages/lists">Lists</a></li><li class="downarrow" style="border-right: 1px solid #000;">↓<ul><li><a href="/webcams/wall">Animal Cams</a></li><li><a href="/audios">Animal Sounds</a></li><li><a href="/indices/cannibals">Cannibals</a></li><li><a href="/indices">Common Species</a></li><li><a href="/edges"><span class="ultooltip" title="Uniqueness & Vulnerability">EDGE Analysis</span></a></li><li><a href="/emblems">Emblems</a></li><li><a href="/endangereds">Endangered Species</a></li><li><a href="/invasives">Invasive Species</a></li><li><a href="/indices/raptors">Raptor Priority</a></li><li><a href="/pages/top100">Top 100 Endangered Species</a></li></ul></li><li style='border-right: 1px solid #000;'><a href="/pages/glossary">Glossary</a></li><li style='border-right: 1px solid #000;'><a href="/pages/about">About</a></li></ul> </div></center>
</div>
<div id="content"><center><table class="tabnoborder"><tr><td>
<div class="container clearfix">
<h1>Climate Data for Latitude 71.25 Longitude 179.75</h1><b>Köppen climate classification</b>: ET (Climate: polar; Temperature: polar tundra)<table class="tabnoborder" width="99%"><tr><td width="20%"> </td><td width="*"><h2>Locations</h2></td><td width ="20%" style="vertical-align:middle;"><a href="/geographics/exportclimate/720/323">Download</a></td></tr></table><div><span style="border: 4px outset; padding:0 1px"><a href="https://maps.google.com?t=h&z=10&ll=71.25,179.75" title="View Google Map" style="text-decoration:none" class="external"><img src="/img/earth-icon.gif" style="vertical-align:middle;" alt=""/> Map</a></span></div><center><table class="tabnoborder"><tr><td style="text-align: left;">Wrangel island<br /></td></tr></table></center><div id="avg100met" style="display: none;"><h2>Averages (Metric) <a href="#" onclick="$('avg100eng').toggle(); $('avg100met').toggle(); return false;">English</a></h2><center><table class="tabnoborder"><thead><tr><th>Type</th><th>Units</th><th>Jan</th><th>Feb</th><th>Mar</th><th>Apr</th><th>May</th><th>Jun</th><th>Jul</th><th>Aug</th><th>Sep</th><th>Oct</th><th>Nov</th><th>Dec</th><th>Period</th></tr></thead><tbody><tr><td style='text-align: left;'>Min Temp</td><td>C°</td><td style="text-align: right;">-30.5</td><td style="text-align: right;">-33.1</td><td style="text-align: right;">-31.5</td><td style="text-align: right;">-25.6</td><td style="text-align: right;">-11.8</td><td style="text-align: right;">-2.7</td><td style="text-align: right;">-0.2</td><td style="text-align: right;">-1<span class="noshow">.0</span></td><td style="text-align: right;">-4.5</td><td style="text-align: right;">-14.5</td><td style="text-align: right;">-22.6</td><td style="text-align: right;">-29<span class="noshow">.0</span></td><td>109 years</td></tr><tr><td style='text-align: left;'>Mean Temp</td><td>C°</td><td style="text-align: right;">-26.5</td><td style="text-align: right;">-29.1</td><td style="text-align: right;">-27.4</td><td style="text-align: right;">-21.2</td><td style="text-align: right;">-8.7</td><td style="text-align: right;">0.1</td><td style="text-align: right;">2.9</td><td style="text-align: right;">1.8</td><td style="text-align: right;">-2.3</td><td style="text-align: right;">-11.6</td><td style="text-align: right;">-19.3</td><td style="text-align: right;">-25.4</td><td>109 years</td></tr><tr><td style='text-align: left;'>Max Temp</td><td>C°</td><td style="text-align: right;">-22.5</td><td style="text-align: right;">-25.1</td><td style="text-align: right;">-23.4</td><td style="text-align: right;">-16.9</td><td style="text-align: right;">-5.7</td><td style="text-align: right;">2.9</td><td style="text-align: right;">6<span class="noshow">.0</span></td><td style="text-align: right;">4.6</td><td style="text-align: right;">-0.1</td><td style="text-align: right;">-8.8</td><td style="text-align: right;">-16<span class="noshow">.0</span></td><td style="text-align: right;">-21.8</td><td>109 years</td></tr><tr><td style='text-align: left;'>Frost</td><td>Days</td><td style="text-align: right;">31<span class="noshow">.0</span></td><td style="text-align: right;">28.2</td><td style="text-align: right;">31<span class="noshow">.0</span></td><td style="text-align: right;">30<span class="noshow">.0</span></td><td style="text-align: right;">31<span class="noshow">.0</span></td><td style="text-align: right;">30<span class="noshow">.0</span></td><td style="text-align: right;">19.9</td><td style="text-align: right;">26.2</td><td style="text-align: right;">30<span class="noshow">.0</span></td><td style="text-align: right;">31<span class="noshow">.0</span></td><td style="text-align: right;">30<span class="noshow">.0</span></td><td style="text-align: right;">31<span class="noshow">.0</span></td><td>109 years</td></tr><tr><td style='text-align: left;'>Wet</td><td>Days</td><td style="text-align: right;">14<span class="noshow">.0</span></td><td style="text-align: right;">8<span class="noshow">.0</span></td><td style="text-align: right;">8<span class="noshow">.0</span></td><td style="text-align: right;">9<span class="noshow">.0</span></td><td style="text-align: right;">11<span class="noshow">.0</span></td><td style="text-align: right;">11.1</td><td style="text-align: right;">13.5</td><td style="text-align: right;">16.2</td><td style="text-align: right;">15.6</td><td style="text-align: right;">15.5</td><td style="text-align: right;">14.3</td><td style="text-align: right;">9<span class="noshow">.0</span></td><td>109 years</td></tr><tr><td style='text-align: left;'>Precipitation</td><td>mm</td><td style="text-align: right;">17<span class="noshow">.0</span></td><td style="text-align: right;">8<span class="noshow">.0</span></td><td style="text-align: right;">8<span class="noshow">.0</span></td><td style="text-align: right;">9<span class="noshow">.0</span></td><td style="text-align: right;">11<span class="noshow">.0</span></td><td style="text-align: right;">17<span class="noshow">.0</span></td><td style="text-align: right;">30<span class="noshow">.0</span></td><td style="text-align: right;">34<span class="noshow">.0</span></td><td style="text-align: right;">26<span class="noshow">.0</span></td><td style="text-align: right;">18<span class="noshow">.0</span></td><td style="text-align: right;">21<span class="noshow">.0</span></td><td style="text-align: right;">9<span class="noshow">.0</span></td><td>109 years</td></tr><tr><td style='text-align: left;'>Potential Evapotranspiration</td><td>mm</td><td style="text-align: right;">3.1</td><td style="text-align: right;">5.6</td><td style="text-align: right;">9.3</td><td style="text-align: right;">12<span class="noshow">.0</span></td><td style="text-align: right;">24.8</td><td style="text-align: right;">45<span class="noshow">.0</span></td><td style="text-align: right;">52.7</td><td style="text-align: right;">34.1</td><td style="text-align: right;">21<span class="noshow">.0</span></td><td style="text-align: right;">9.3</td><td style="text-align: right;">6<span class="noshow">.0</span></td><td style="text-align: right;">6.2</td><td>109 years</td></tr></tbody></table></center><div><img src="/climate/720_323_yravgtempmet.png" alt="Yearly Average Temperatures 2010 - 2009 (Metric) Latitude 71.25 Longitude 179.75" /></div><div><img src="/climate/720_323_yrmthmeanmet.png" alt="Monthly Mean Temperatures 1901 - 2009 (Metric) Latitude 71.25 Longitude 179.75" /></div><div><img src="/climate/720_323_yrtotfrost.png" alt="Yearly Total Frost Days 1901 - 2009 Latitude 71.25 Longitude 179.75" /></div><div><img src="/climate/720_323_yrtotprecipmet.png" alt="Yearly Total Precipitation 1901 - 2009 (Metric) Latitude 71.25 Longitude 179.75" /></div><div><img src="/climate/720_323_yrtotwet.png" alt="Yearly Total Wet Days 1901 - 2009 Latitude 71.25 Longitude 179.75" /></div><div><img src="/climate/720_323_yrtotpetmet.png" alt="Yearly Total Potential Evapotranspiration 1901 - 2009 (Metric) Latitude 71.25 Longitude 179.75" /></div></div><div id="avg100eng" style="display: block;"><h2>Averages (English) <a href="#" onclick="$('avg100eng').toggle(); $('avg100met').toggle(); return false;">Metric</a></h2><center><table class="tabnoborder"><thead><tr><th>Type</th><th>Units</th><th>Jan</th><th>Feb</th><th>Mar</th><th>Apr</th><th>May</th><th>Jun</th><th>Jul</th><th>Aug</th><th>Sep</th><th>Oct</th><th>Nov</th><th>Dec</th><th>Period</th></tr></thead><tbody><tr><td style='text-align: left;'>Min Temp</td><td>F°</td><td style="text-align: right;">-22.9</td><td style="text-align: right;">-27.6</td><td style="text-align: right;">-24.7</td><td style="text-align: right;">-14.1</td><td style="text-align: right;">10.8</td><td style="text-align: right;">27.1</td><td style="text-align: right;">31.6</td><td style="text-align: right;">30.2</td><td style="text-align: right;">23.9</td><td style="text-align: right;">5.9</td><td style="text-align: right;">-8.7</td><td style="text-align: right;">-20.2</td><td>109 years</td></tr><tr><td style='text-align: left;'>Mean Temp</td><td>F°</td><td style="text-align: right;">-15.7</td><td style="text-align: right;">-20.4</td><td style="text-align: right;">-17.3</td><td style="text-align: right;">-6.2</td><td style="text-align: right;">16.3</td><td style="text-align: right;">32.2</td><td style="text-align: right;">37.2</td><td style="text-align: right;">35.2</td><td style="text-align: right;">27.9</td><td style="text-align: right;">11.1</td><td style="text-align: right;">-2.7</td><td style="text-align: right;">-13.7</td><td>109 years</td></tr><tr><td style='text-align: left;'>Max Temp</td><td>F°</td><td style="text-align: right;">-8.5</td><td style="text-align: right;">-13.2</td><td style="text-align: right;">-10.1</td><td style="text-align: right;">1.6</td><td style="text-align: right;">21.7</td><td style="text-align: right;">37.2</td><td style="text-align: right;">42.8</td><td style="text-align: right;">40.3</td><td style="text-align: right;">31.8</td><td style="text-align: right;">16.2</td><td style="text-align: right;">3.2</td><td style="text-align: right;">-7.2</td><td>109 years</td></tr><tr><td style='text-align: left;'>Frost</td><td>Days</td><td style="text-align: right;">31<span class="noshow">.0</span></td><td style="text-align: right;">28.2</td><td style="text-align: right;">31<span class="noshow">.0</span></td><td style="text-align: right;">30<span class="noshow">.0</span></td><td style="text-align: right;">31<span class="noshow">.0</span></td><td style="text-align: right;">30<span class="noshow">.0</span></td><td style="text-align: right;">19.9</td><td style="text-align: right;">26.2</td><td style="text-align: right;">30<span class="noshow">.0</span></td><td style="text-align: right;">31<span class="noshow">.0</span></td><td style="text-align: right;">30<span class="noshow">.0</span></td><td style="text-align: right;">31<span class="noshow">.0</span></td><td>109 years</td></tr><tr><td style='text-align: left;'>Wet</td><td>Days</td><td style="text-align: right;">14<span class="noshow">.0</span></td><td style="text-align: right;">8<span class="noshow">.0</span></td><td style="text-align: right;">8<span class="noshow">.0</span></td><td style="text-align: right;">9<span class="noshow">.0</span></td><td style="text-align: right;">11<span class="noshow">.0</span></td><td style="text-align: right;">11.1</td><td style="text-align: right;">13.5</td><td style="text-align: right;">16.2</td><td style="text-align: right;">15.6</td><td style="text-align: right;">15.5</td><td style="text-align: right;">14.3</td><td style="text-align: right;">9<span class="noshow">.0</span></td><td>109 years</td></tr><tr><td style='text-align: left;'>Precipitation</td><td>in</td><td style="text-align: right;">0.7</td><td style="text-align: right;">0.3</td><td style="text-align: right;">0.3</td><td style="text-align: right;">0.4</td><td style="text-align: right;">0.4</td><td style="text-align: right;">0.7</td><td style="text-align: right;">1.2</td><td style="text-align: right;">1.3</td><td style="text-align: right;">1<span class="noshow">.0</span></td><td style="text-align: right;">0.7</td><td style="text-align: right;">0.8</td><td style="text-align: right;">0.4</td><td>109 years</td></tr><tr><td style='text-align: left;'>Potential Evapotranspiration</td><td>in</td><td style="text-align: right;">0.1</td><td style="text-align: right;">0.2</td><td style="text-align: right;">0.4</td><td style="text-align: right;">0.5</td><td style="text-align: right;">1<span class="noshow">.0</span></td><td style="text-align: right;">1.8</td><td style="text-align: right;">2.1</td><td style="text-align: right;">1.3</td><td style="text-align: right;">0.8</td><td style="text-align: right;">0.4</td><td style="text-align: right;">0.2</td><td style="text-align: right;">0.2</td><td>109 years</td></tr></tbody></table></center><div><img src="/climate/720_323_yravgtempeng.png" alt="Yearly Average Temperatures 2010 - 2009 (English) Latitude 71.25 Longitude 179.75" /></div><div><img src="/climate/720_323_yrmthmeaneng.png" alt="Monthly Mean Temperatures 1901 - 2009 (English) Latitude 71.25 Longitude 179.75" /></div><div><img src="/climate/720_323_yrtotfrost.png" alt="Yearly Total Frost Days 1901 - 2009 Latitude 71.25 Longitude 179.75" /></div><div><img src="/climate/720_323_yrtotprecipeng.png" alt="Yearly Total Precipitation 1901 - 2009 (English) Latitude 71.25 Longitude 179.75" /></div><div><img src="/climate/720_323_yrtotwet.png" alt="Yearly Total Wet Days 1901 - 2009 Latitude 71.25 Longitude 179.75" /></div><div><img src="/climate/720_323_yrtotpeteng.png" alt="Yearly Total Potential Evapotranspiration 1901 - 2009 (English) Latitude 71.25 Longitude 179.75" /></div></div><br />
<div style="text-align: left;">
<div class="citation">Climate data provided by <a href="http://badc.nerc.ac.uk/view/badc.nerc.ac.uk__ATOM__dataent_1256223773328276" class="external">CRU TS 3.1</a> - University of East Anglia Climate Research Unit (CRU). [Phil Jones, Ian Harris]. CRU Time Series (TS) high resolution gridded datasets, [Internet]. NCAS British Atmospheric Data Centre, 2008, Accessed: 28-July-2011</div><div class="citation">Charting software provided by <a href="http://pchart.sourceforge.net/index.php" class="external">pChart</a> - a PHP class to build charts.</div><div class="citation">Köppen climate classification provided by Kottek, M., J. Grieser, C. Beck, B. Rudolf, and F. Rubel, <a href="http://koeppen-geiger.vu-wien.ac.at/present.htm" class="external">2006: World Map of Köppen-Geiger Climate Classification updated</a>. Meteorol. Z., 15, 259-263</div><div class="citation">The calculation method for the potential evapotranspiration is the FAO grass reference equation (Ekstrom et al., 2007, which is based on Allen et al., 1994).
It is a variant of the Penman Monteith method using TMP, TMN, TMX, VAP, CLD.</div>
</div>
</div>
</td></tr></table></center></div>
<div id="footer">
<table width="100%"><tr>
<td width="30%" align="left">
</td>
<td width="*">
<a accesskey="9" style="text-decoration: none" href="mailto:species@brucemyers.com">Email</a>
</td>
<td width="30%">
© WorldSpecies.org 2020-2023
</td>
</tr></table>
</div>
</div>
</body>
</html>
'
}
$cookies = []
$values = [
(int) 0 => 'text/html; charset=UTF-8'
]
$name = 'Content-Type'
$first = true
$value = 'text/html; charset=UTF-8' header - [internal], line ??
Cake\Http\ResponseEmitter::emitHeaders() - CORE/src/Http/ResponseEmitter.php, line 177
Cake\Http\ResponseEmitter::emit() - CORE/src/Http/ResponseEmitter.php, line 55
Cake\Http\Server::emit() - CORE/src/Http/Server.php, line 141
[main] - ROOT/webroot/index.php, line 40 World Species : Climate Data for Latitude 71.25 Longitude 179.75
Climate Data for Latitude 71.25 Longitude 179.75 Köppen climate classification : ET (Climate: polar; Temperature: polar tundra)
Averages (Metric) English Type Units Jan Feb Mar Apr May Jun Jul Aug Sep Oct Nov Dec Period Min Temp C° -30.5 -33.1 -31.5 -25.6 -11.8 -2.7 -0.2 -1.0 -4.5 -14.5 -22.6 -29.0 109 years Mean Temp C° -26.5 -29.1 -27.4 -21.2 -8.7 0.1 2.9 1.8 -2.3 -11.6 -19.3 -25.4 109 years Max Temp C° -22.5 -25.1 -23.4 -16.9 -5.7 2.9 6.0 4.6 -0.1 -8.8 -16.0 -21.8 109 years Frost Days 31.0 28.2 31.0 30.0 31.0 30.0 19.9 26.2 30.0 31.0 30.0 31.0 109 years Wet Days 14.0 8.0 8.0 9.0 11.0 11.1 13.5 16.2 15.6 15.5 14.3 9.0 109 years Precipitation mm 17.0 8.0 8.0 9.0 11.0 17.0 30.0 34.0 26.0 18.0 21.0 9.0 109 years Potential Evapotranspiration mm 3.1 5.6 9.3 12.0 24.8 45.0 52.7 34.1 21.0 9.3 6.0 6.2 109 years
Averages (English) Metric Type Units Jan Feb Mar Apr May Jun Jul Aug Sep Oct Nov Dec Period Min Temp F° -22.9 -27.6 -24.7 -14.1 10.8 27.1 31.6 30.2 23.9 5.9 -8.7 -20.2 109 years Mean Temp F° -15.7 -20.4 -17.3 -6.2 16.3 32.2 37.2 35.2 27.9 11.1 -2.7 -13.7 109 years Max Temp F° -8.5 -13.2 -10.1 1.6 21.7 37.2 42.8 40.3 31.8 16.2 3.2 -7.2 109 years Frost Days 31.0 28.2 31.0 30.0 31.0 30.0 19.9 26.2 30.0 31.0 30.0 31.0 109 years Wet Days 14.0 8.0 8.0 9.0 11.0 11.1 13.5 16.2 15.6 15.5 14.3 9.0 109 years Precipitation in 0.7 0.3 0.3 0.4 0.4 0.7 1.2 1.3 1.0 0.7 0.8 0.4 109 years Potential Evapotranspiration in 0.1 0.2 0.4 0.5 1.0 1.8 2.1 1.3 0.8 0.4 0.2 0.2 109 years
Climate data provided by
CRU TS 3.1 - University of East Anglia Climate Research Unit (CRU). [Phil Jones, Ian Harris]. CRU Time Series (TS) high resolution gridded datasets, [Internet]. NCAS British Atmospheric Data Centre, 2008, Accessed: 28-July-2011
Charting software provided by
pChart - a PHP class to build charts.
The calculation method for the potential evapotranspiration is the FAO grass reference equation (Ekstrom et al., 2007, which is based on Allen et al., 1994).
It is a variant of the Penman Monteith method using TMP, TMN, TMX, VAP, CLD.