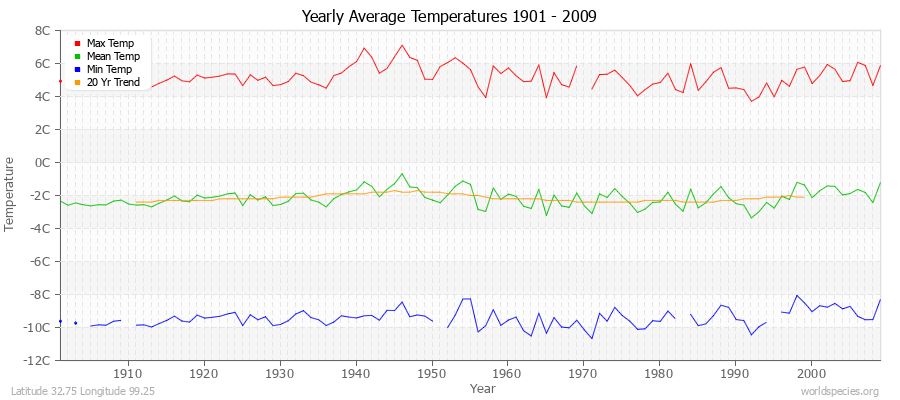
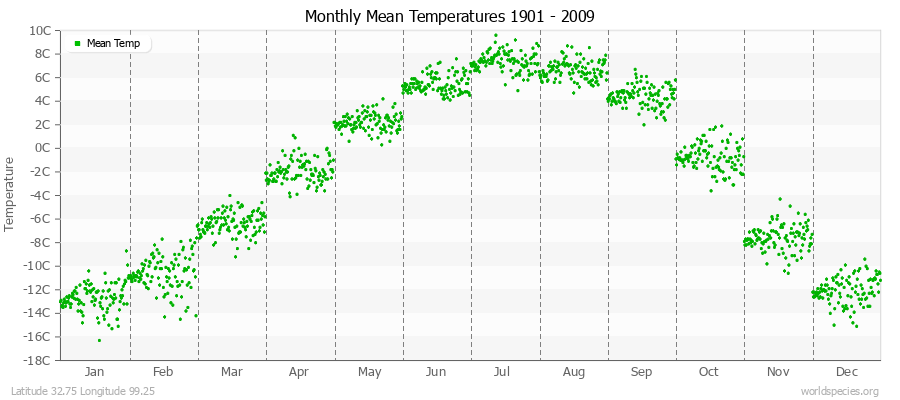
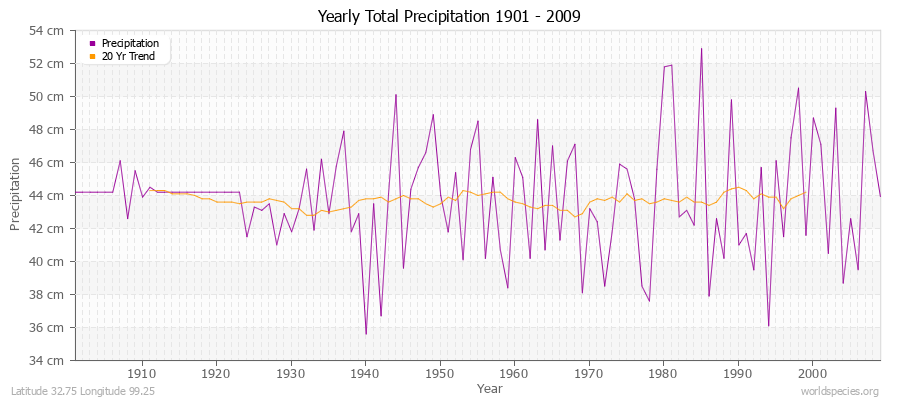
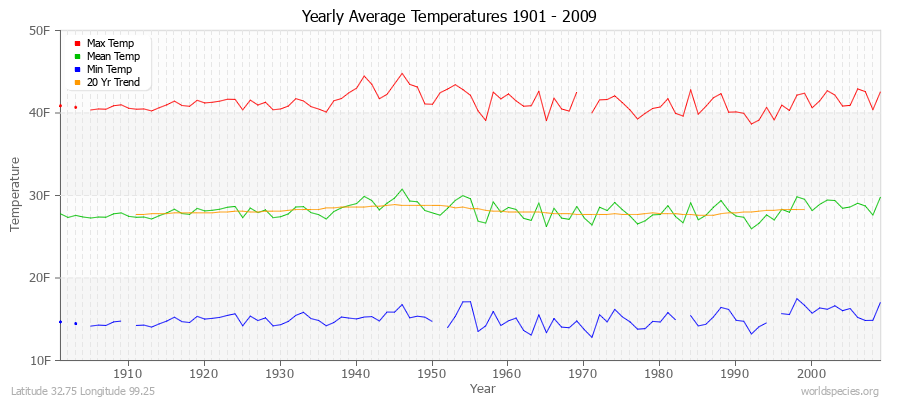
Climate Data for Latitude 32.75 Longitude 99.25

Köppen climate classification: ET (Climate: polar; Temperature: polar tundra)
 

Locations

Download
Southeast Tibet shrub and meadows ecoregion

Averages (English) Metric

TypeUnitsJanFebMarAprMayJunJulAugSepOctNovDecPeriod
Min Temp-7.4-2.36.615.824.131.334.832.929.018.73.4-6.7103 years
Mean Temp9.112.920.528.536.041.845.343.940.030.618.310.3109 years
Max Temp25.728.334.541.347.952.456.055.151.042.533.327.3106 years
FrostDays31.028.231.030.031.025.220.023.130.031.030.031.0109 years
WetDays1.31.96.111.923.327.130.729.128.612.13.41.0109 years
Precipitationin0.10.20.40.71.83.73.43.02.71.10.20.1109 years
Potential Evapotranspirationin1.21.52.32.93.83.73.63.42.92.31.51.2109 years
Yearly Average Temperatures 2010 - 2009 (English) Latitude 32.75 Longitude 99.25
Monthly Mean Temperatures 1901 - 2009 (English) Latitude 32.75 Longitude 99.25
Yearly Total Frost Days 1901 - 2009 Latitude 32.75 Longitude 99.25
Yearly Total Precipitation 1901 - 2009 (English) Latitude 32.75 Longitude 99.25
Yearly Total Wet Days 1901 - 2009 Latitude 32.75 Longitude 99.25
Yearly Total Potential Evapotranspiration 1901 - 2009 (English) Latitude 32.75 Longitude 99.25

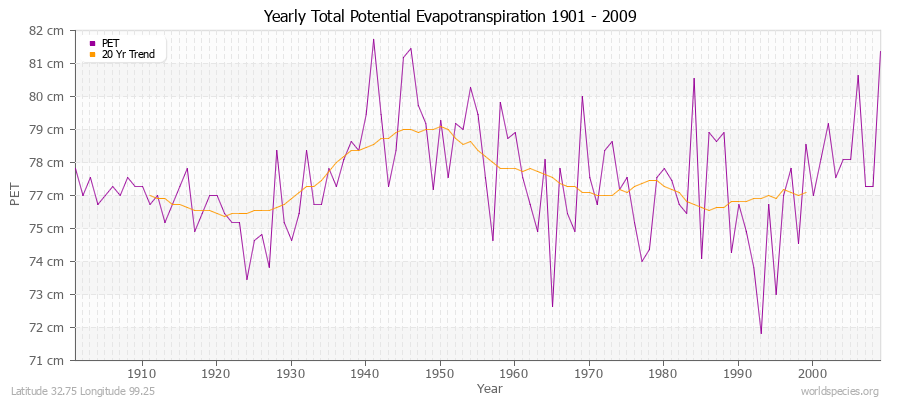
Climate data provided by CRU TS 3.1 - University of East Anglia Climate Research Unit (CRU). [Phil Jones, Ian Harris]. CRU Time Series (TS) high resolution gridded datasets, [Internet]. NCAS British Atmospheric Data Centre, 2008, Accessed: 28-July-2011
Charting software provided by pChart - a PHP class to build charts.
Köppen climate classification provided by Kottek, M., J. Grieser, C. Beck, B. Rudolf, and F. Rubel, 2006: World Map of Köppen-Geiger Climate Classification updated. Meteorol. Z., 15, 259-263
The calculation method for the potential evapotranspiration is the FAO grass reference equation (Ekstrom et al., 2007, which is based on Allen et al., 1994). It is a variant of the Penman Monteith method using TMP, TMN, TMX, VAP, CLD.