Climate Data for Latitude 18.75 Longitude 56.75


Locations

Download
Khawr Ghawi

Averages (English) Metric

TypeUnitsJanFebMarAprMayJunJulAugSepOctNovDecPeriod
Min Temp61.364.968.174.178.279.577.175.774.571.667.764.3109 years
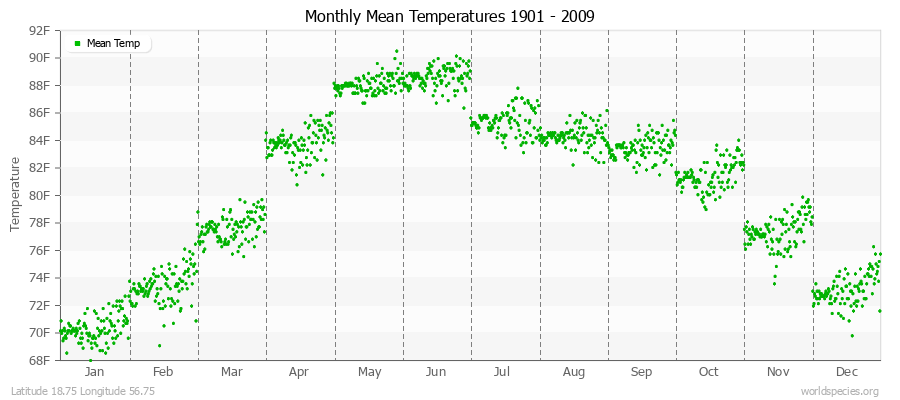
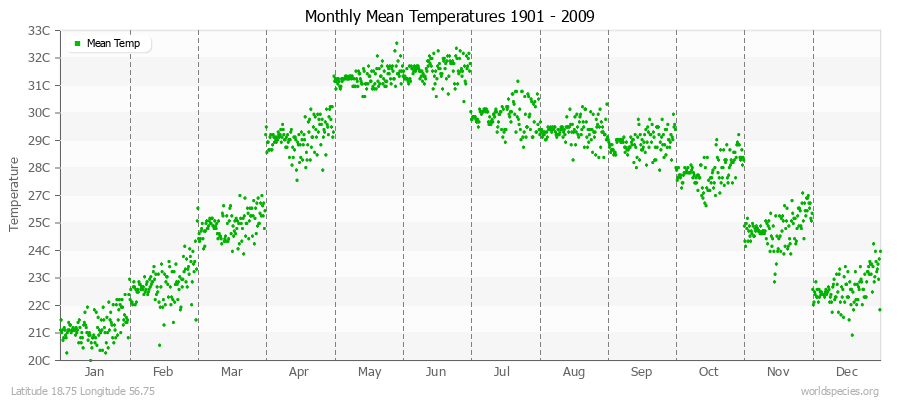
Mean Temp70.373.477.683.888.188.685.484.383.581.477.473.1109 years
Max Temp79.482.087.293.798.097.893.893.192.691.387.182.1109 years
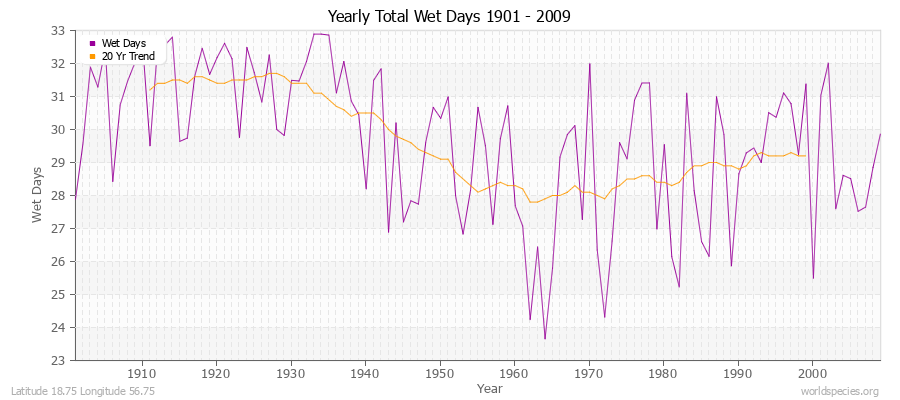
WetDays0.72.00.91.01.71.77.15.93.52.01.61.6109 years
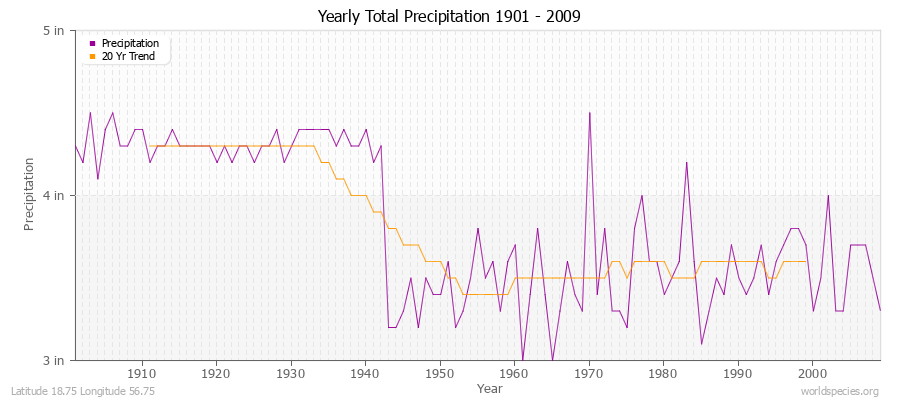
Precipitationin0.40.30.30.30.40.30.30.20.40.50.20.2109 years
Yearly Average Temperatures 2010 - 2009 (English) Latitude 18.75 Longitude 56.75
Monthly Mean Temperatures 1901 - 2009 (English) Latitude 18.75 Longitude 56.75
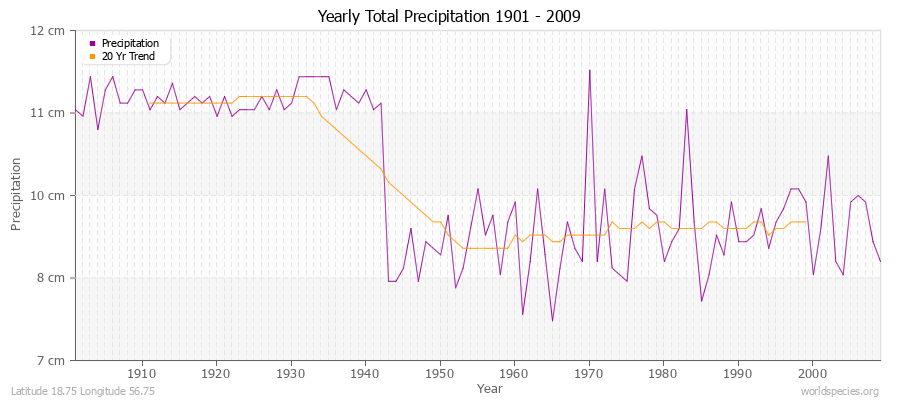
Yearly Total Precipitation 1901 - 2009 (English) Latitude 18.75 Longitude 56.75
Yearly Total Wet Days 1901 - 2009 Latitude 18.75 Longitude 56.75

Climate data provided by CRU TS 3.1 - University of East Anglia Climate Research Unit (CRU). [Phil Jones, Ian Harris]. CRU Time Series (TS) high resolution gridded datasets, [Internet]. NCAS British Atmospheric Data Centre, 2008, Accessed: 28-July-2011
Charting software provided by pChart - a PHP class to build charts.
The calculation method for the potential evapotranspiration is the FAO grass reference equation (Ekstrom et al., 2007, which is based on Allen et al., 1994). It is a variant of the Penman Monteith method using TMP, TMN, TMX, VAP, CLD.