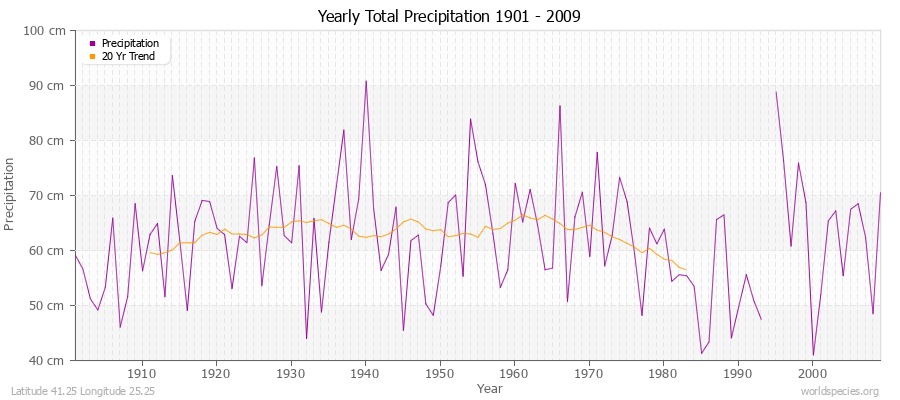
Climate Data for Latitude 41.25 Longitude 25.25Köppen climate classification: Csa (Climate: warm temperate; Precipitation: summer dry; Temperature: hot summer) KOILADA KOMPSATOU
Kompsatos valley
LIMNES VISTONIS, ISMARIS - LIMNOTHALASSES PORTO LAGOS, ALYKI PTELEA, XIROLIMNI, KARATZA
Porto Lagos, Lake Vistonis, and coastal lagoons (Lakes of Thrace)
POTAMOS KOMPSATOS (NEA KOITI)
|
Averages (Metric) English| Type | Units | Jan | Feb | Mar | Apr | May | Jun | Jul | Aug | Sep | Oct | Nov | Dec | Period |
|---|
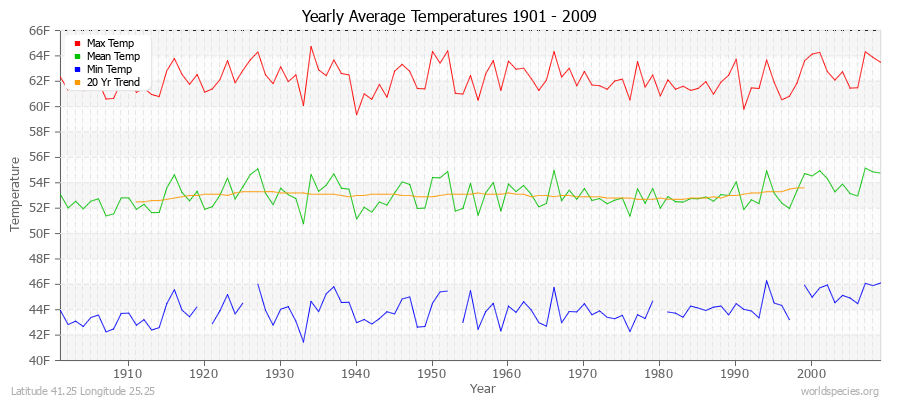
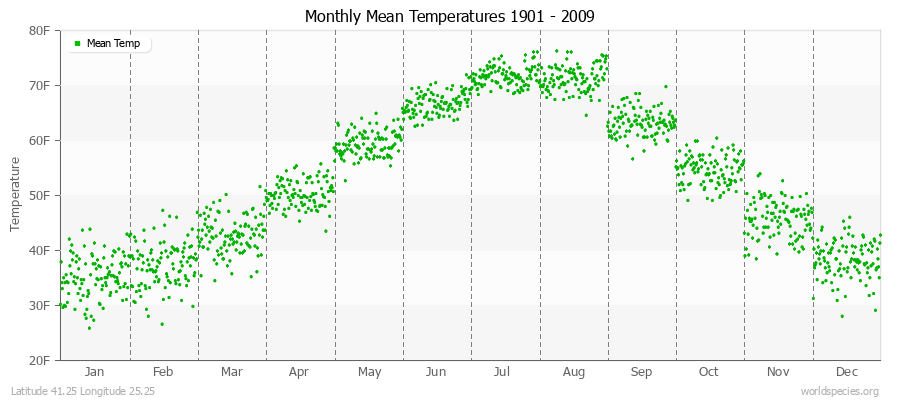
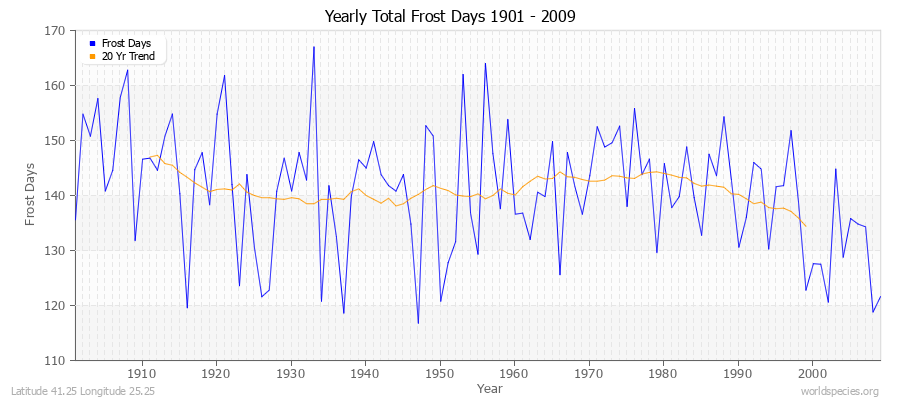
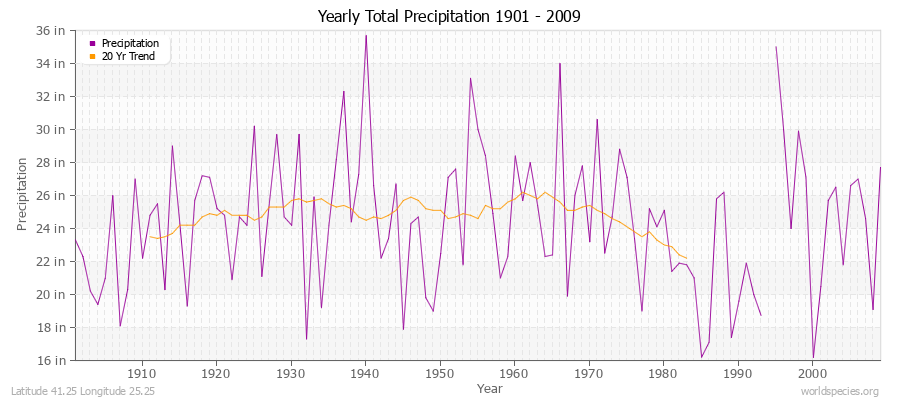
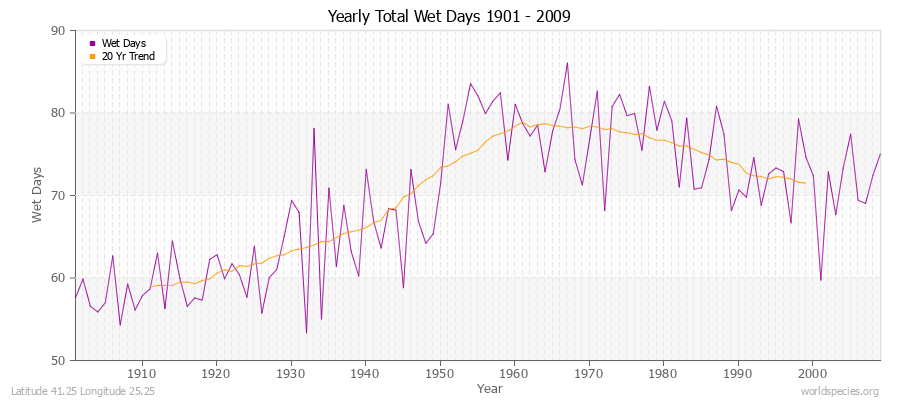
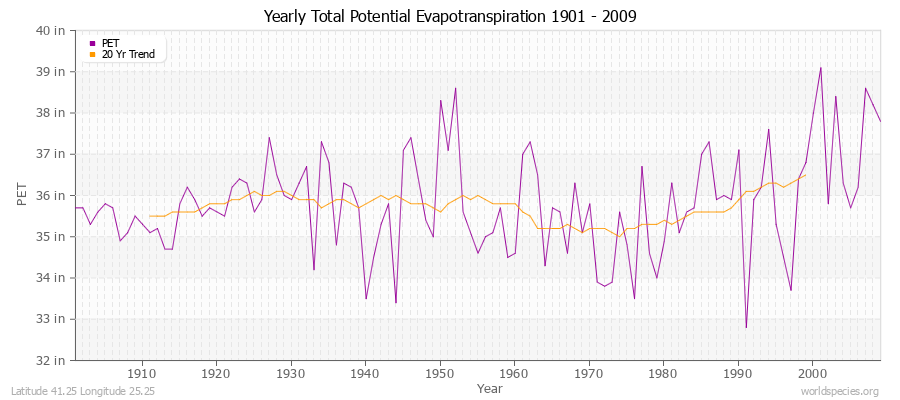
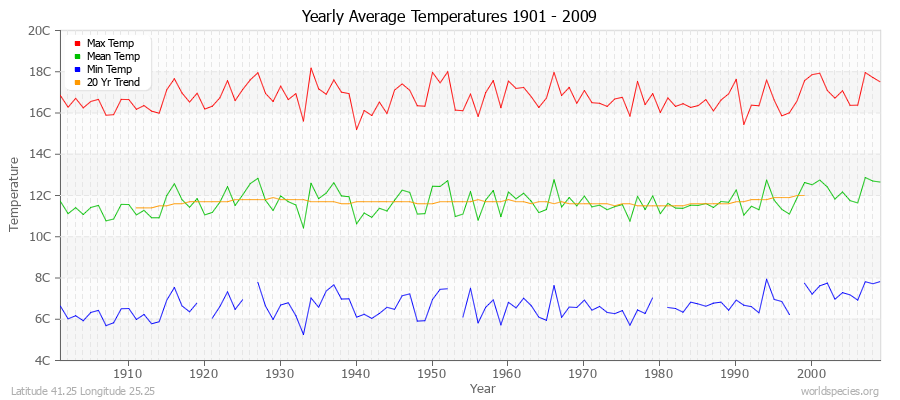
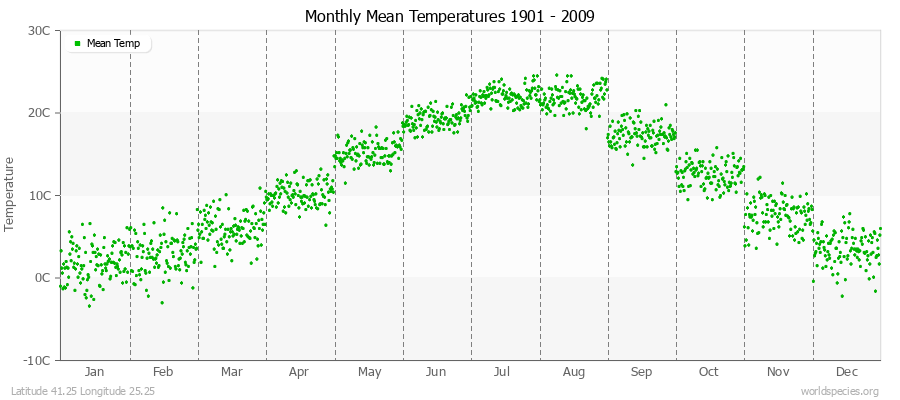
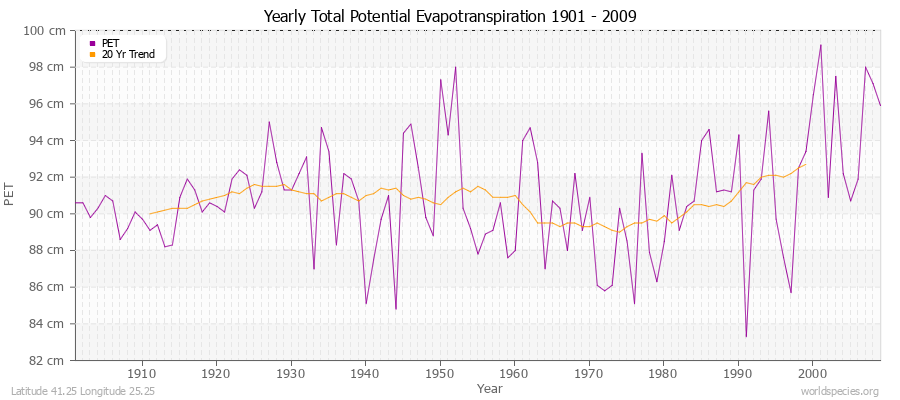
| Min Temp | C° | -1.8 | -0.9 | 1.4 | 5.1 | 9.5 | 13.1 | 15.7 | 15.3 | 11.4 | 7.5 | 3.8 | 0.0 | 104 years | | Mean Temp | C° | 1.7 | 3.0 | 6.0 | 10.1 | 15.2 | 19.3 | 22.0 | 21.8 | 17.4 | 12.6 | 7.7 | 3.5 | 109 years | | Max Temp | C° | 5.3 | 6.8 | 10.6 | 15.2 | 21.0 | 25.5 | 28.5 | 28.4 | 23.4 | 17.7 | 11.7 | 7.1 | 109 years | | Frost | Days | 30.8 | 27.3 | 22.1 | 6.8 | 3.0 | 2.6 | 0.2 | 0.3 | 2.8 | 3.5 | 15.0 | 26.4 | 109 years | | Wet | Days | 7.9 | 7.1 | 6.5 | 6.5 | 8.1 | 5.5 | 3.8 | 2.7 | 2.8 | 4.3 | 6.6 | 7.9 | 109 years | | Precipitation | mm | 63.2 | 54.1 | 47.1 | 44.8 | 54.6 | 45.9 | 33.9 | 22.3 | 32.4 | 51.6 | 73.9 | 94.6 | 108 years | | Potential Evapotranspiration | mm | 23.9 | 30.9 | 51.4 | 73.1 | 103.7 | 129.7 | 154.8 | 142.6 | 93.8 | 56.1 | 27.7 | 21.6 | 109 years |
Averages (English) Metric| Type | Units | Jan | Feb | Mar | Apr | May | Jun | Jul | Aug | Sep | Oct | Nov | Dec | Period |
|---|
| Min Temp | F° | 28.7 | 30.4 | 34.6 | 41.1 | 49.1 | 55.6 | 60.2 | 59.5 | 52.4 | 45.5 | 38.8 | 32.0 | 104 years | | Mean Temp | F° | 35.1 | 37.3 | 42.8 | 50.3 | 59.4 | 66.7 | 71.7 | 71.2 | 63.3 | 54.6 | 45.8 | 38.3 | 109 years | | Max Temp | F° | 41.5 | 44.3 | 51.1 | 59.4 | 69.7 | 77.9 | 83.2 | 83.1 | 74.2 | 63.9 | 53.0 | 44.8 | 109 years | | Frost | Days | 30.8 | 27.3 | 22.1 | 6.8 | 3.0 | 2.6 | 0.2 | 0.3 | 2.8 | 3.5 | 15.0 | 26.4 | 109 years | | Wet | Days | 7.9 | 7.1 | 6.5 | 6.5 | 8.1 | 5.5 | 3.8 | 2.7 | 2.8 | 4.3 | 6.6 | 7.9 | 109 years | | Precipitation | in | 2.5 | 2.1 | 1.9 | 1.8 | 2.2 | 1.8 | 1.3 | 0.9 | 1.3 | 2.0 | 2.9 | 3.7 | 108 years | | Potential Evapotranspiration | in | 0.9 | 1.2 | 2.0 | 2.9 | 4.1 | 5.1 | 6.1 | 5.6 | 3.7 | 2.2 | 1.1 | 0.8 | 109 years |
Climate data provided by CRU TS 3.1 - University of East Anglia Climate Research Unit (CRU). [Phil Jones, Ian Harris]. CRU Time Series (TS) high resolution gridded datasets, [Internet]. NCAS British Atmospheric Data Centre, 2008, Accessed: 28-July-2011 Charting software provided by pChart - a PHP class to build charts. The calculation method for the potential evapotranspiration is the FAO grass reference equation (Ekstrom et al., 2007, which is based on Allen et al., 1994).
It is a variant of the Penman Monteith method using TMP, TMN, TMX, VAP, CLD.
|