Climate Data for Latitude 50.75 Longitude 11.25

Köppen climate classification: Cfb (Climate: warm temperate; Precipitation: fully humid; Temperature: warm summer)
 

Locations

Download
Edelmannsberg
Ferienheim Martinsroda
Fledermausquartiere Königsee
Fledermauswochenstuben Kleingölitz
Großes Holz - Sperlingsberg
Ilm-Aue von Gräfinau-Angstedt bis Stadtilm
Ilmtal zwischen Bad Berka und Weimar mit Buchfarter Wald
Kirche Reichenbach
Klosterholz
Langer Berg - Buntsandstein-Waldland um Paulinzella
Muschelkalk-Landschaft westlich Rudolstadt
Muschelkalkgebiet südöstlich Erfurt
Muschelkalkhänge um Teichel und Großkochberg
Nördliches Thüringer Schiefergebirge mit Schwarzatal
NSG Schenkenberg
NSG Tännreisig
Pennewitzer Teiche - Unteres Wohlrosetal
Saaletal zwischen Hohenwarte und Saalfeld
Schieferbruch Unterweißbach
Schieferbrüche bei Probstzella
Schieferbrüche um Lehesten
Schwarzatal ab Goldisthal mit Zuflüssen
Stollen Gottschild Kamsdorf
Vordere und Hintere Heide südlich Uhlstädt
Westliches Schiefergebirge um Steinheid und Scheibe-Alsbach

Averages (English) Metric

TypeUnitsJanFebMarAprMayJunJulAugSepOctNovDecPeriod
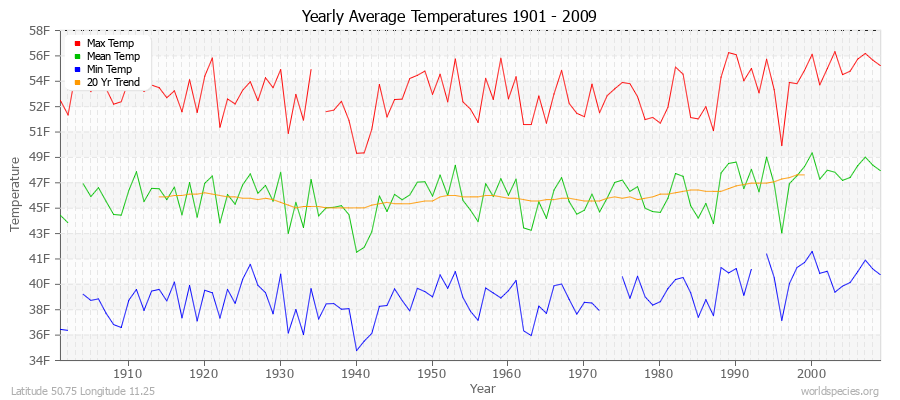
Min Temp24.325.230.436.444.450.053.552.747.039.533.127.3105 years
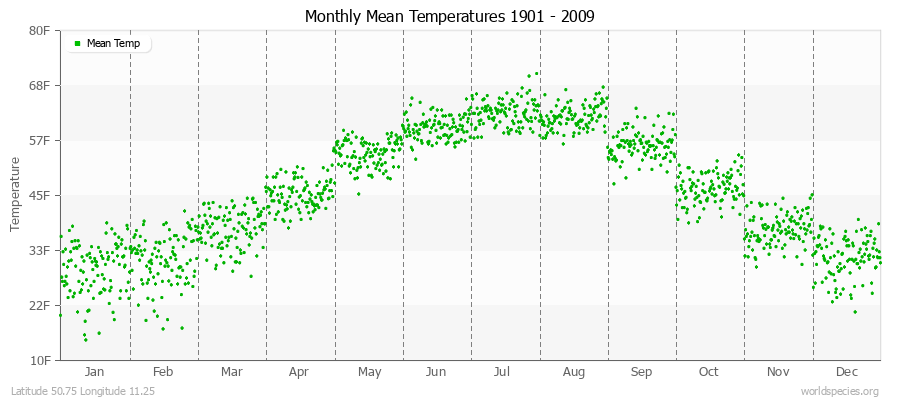
Mean Temp29.431.137.845.253.959.462.561.655.646.537.831.8108 years
Max Temp34.337.045.354.163.468.971.670.664.453.642.536.2108 years
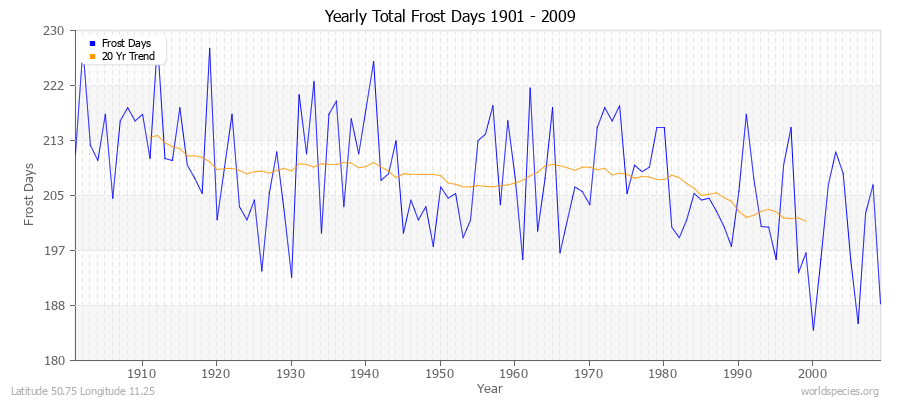
FrostDays31.028.231.021.97.31.10.60.55.720.428.931.0109 years
WetDays17.313.913.113.314.314.214.314.612.411.714.816.9109 years
Precipitationin1.31.11.41.62.22.52.72.31.71.51.51.4109 years
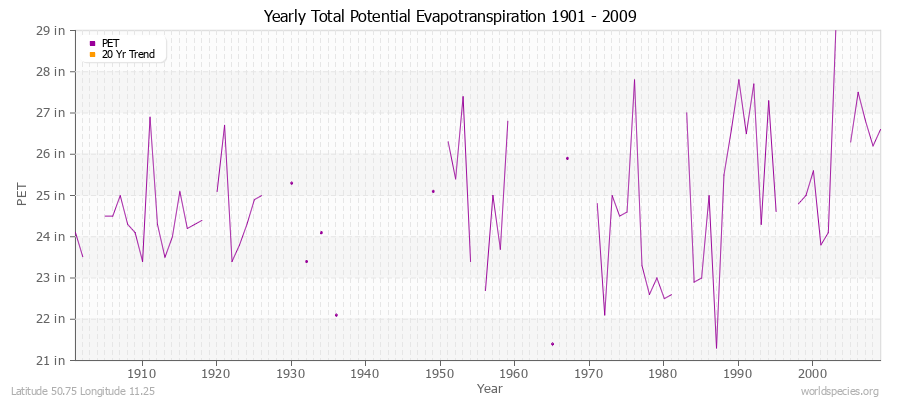
Potential Evapotranspirationin0.40.61.52.43.64.04.23.62.31.20.60.473 years
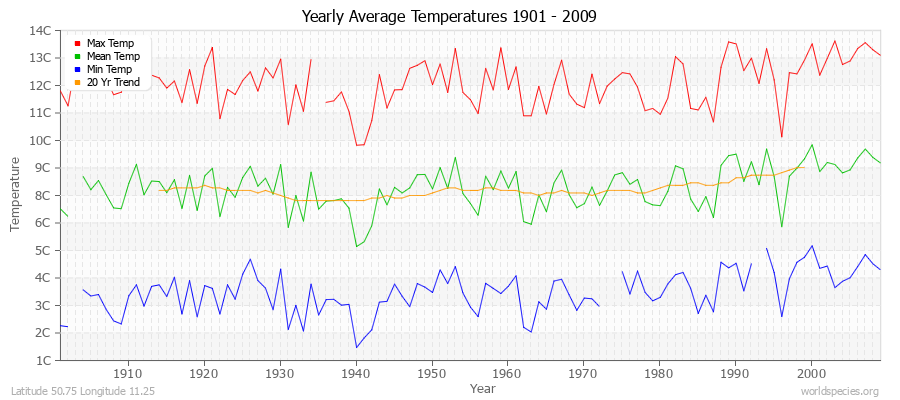
Yearly Average Temperatures 2010 - 2009 (English) Latitude 50.75 Longitude 11.25
Monthly Mean Temperatures 1901 - 2009 (English) Latitude 50.75 Longitude 11.25
Yearly Total Frost Days 1901 - 2009 Latitude 50.75 Longitude 11.25
Yearly Total Precipitation 1901 - 2009 (English) Latitude 50.75 Longitude 11.25
Yearly Total Wet Days 1901 - 2009 Latitude 50.75 Longitude 11.25
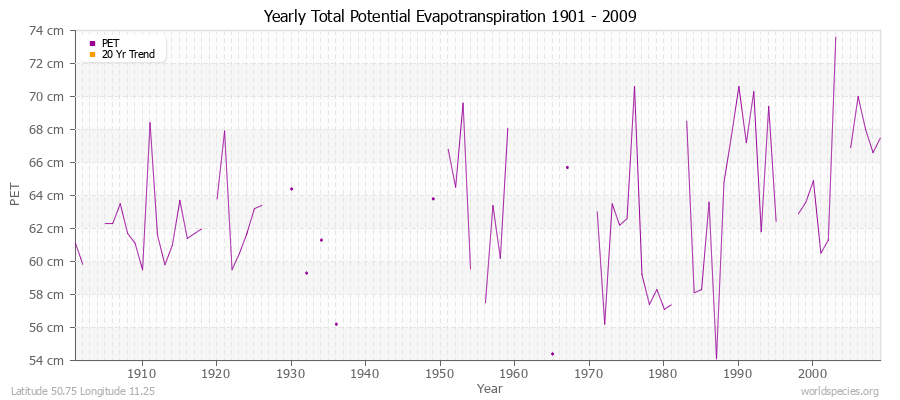
Yearly Total Potential Evapotranspiration 1901 - 2009 (English) Latitude 50.75 Longitude 11.25

Climate data provided by CRU TS 3.1 - University of East Anglia Climate Research Unit (CRU). [Phil Jones, Ian Harris]. CRU Time Series (TS) high resolution gridded datasets, [Internet]. NCAS British Atmospheric Data Centre, 2008, Accessed: 28-July-2011
Charting software provided by pChart - a PHP class to build charts.
Köppen climate classification provided by Kottek, M., J. Grieser, C. Beck, B. Rudolf, and F. Rubel, 2006: World Map of Köppen-Geiger Climate Classification updated. Meteorol. Z., 15, 259-263
The calculation method for the potential evapotranspiration is the FAO grass reference equation (Ekstrom et al., 2007, which is based on Allen et al., 1994). It is a variant of the Penman Monteith method using TMP, TMN, TMX, VAP, CLD.