Climate Data for Latitude 51.25 Longitude 10.75

Köppen climate classification: Cfb (Climate: warm temperate; Precipitation: fully humid; Temperature: warm summer)
 

Locations

Download
Ackerhügelland westlich Erfurt mit Fahnerscher Höhe
Bleicheröder Berge
Bruchwiesen bei Bad Tennstedt
Dickkopf - Bendeleber Forst - NSG Gatterberge
Gera-Unstrut-Niederung um Straußfurt
Gräben im Großen Ried
Gustav-Adolf-Kapelle Witterda
Hainleite - Westliche Schmücke
Helme mit Mühlgräben
Helmestausee Berga-Kelbra (Anteil Sachsen-Anhalt)
Keuperhügel und Unstrutniederung bei Mühlhausen
NSG Hotzenberg
NSG Keulaer Wald
NSG Unstruttal zwischen Nägelstedt und Großvargula
Reesberg
Sonder - Oberholz - Großer Horn
Unstrut-Niederung nordöstlich Herbsleben
Volkenrodaer Teiche
Westliche Hainleite - Wöbelsburg

Averages (English) Metric

TypeUnitsJanFebMarAprMayJunJulAugSepOctNovDecPeriod
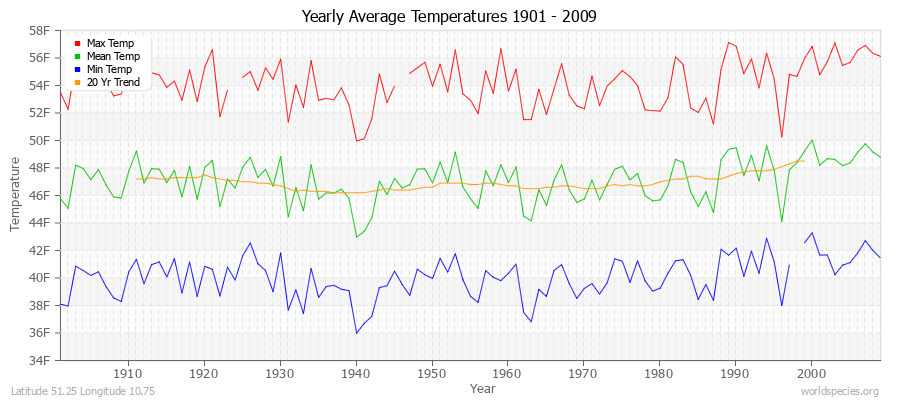
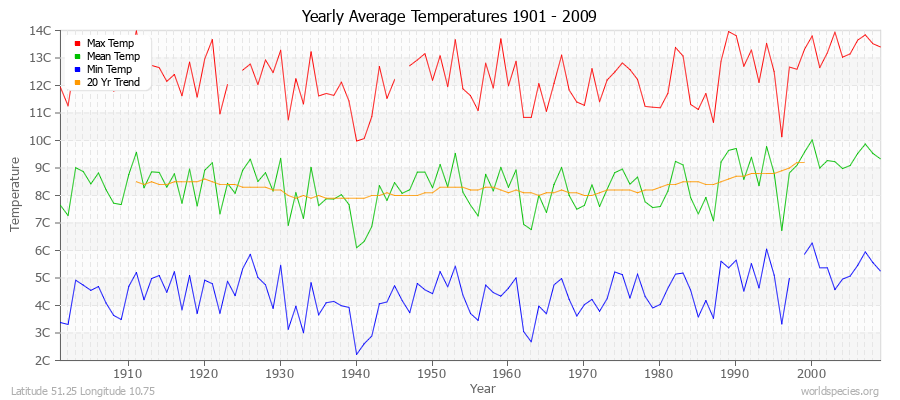
Min Temp26.326.931.837.845.651.154.754.048.140.834.829.1108 years
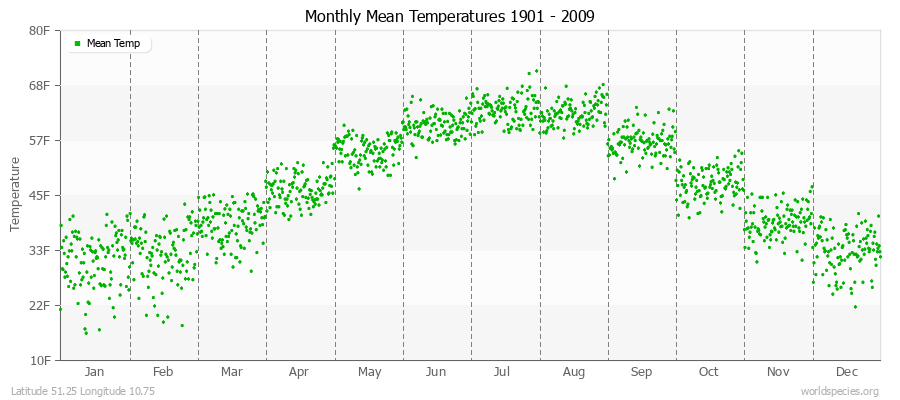
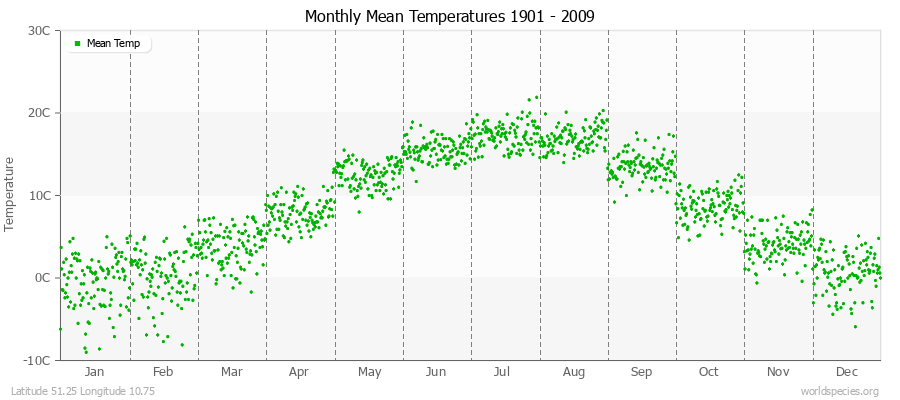
Mean Temp31.132.538.946.254.559.963.262.456.347.539.333.2109 years
Max Temp35.938.246.154.663.468.971.770.964.554.444.037.5107 years
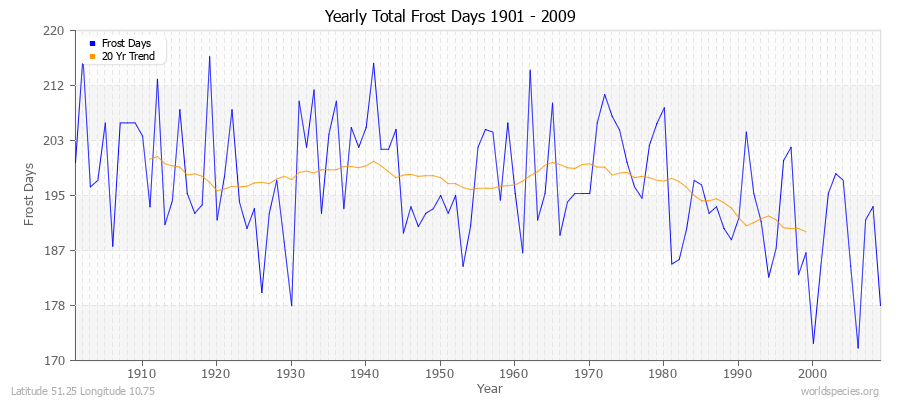
FrostDays31.028.230.717.85.81.80.80.14.417.427.530.9109 years
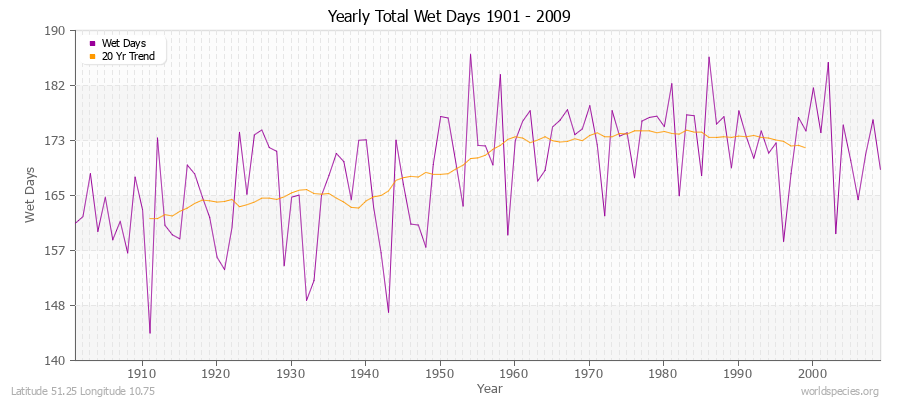
WetDays17.213.512.913.413.714.114.114.812.211.514.716.9109 years
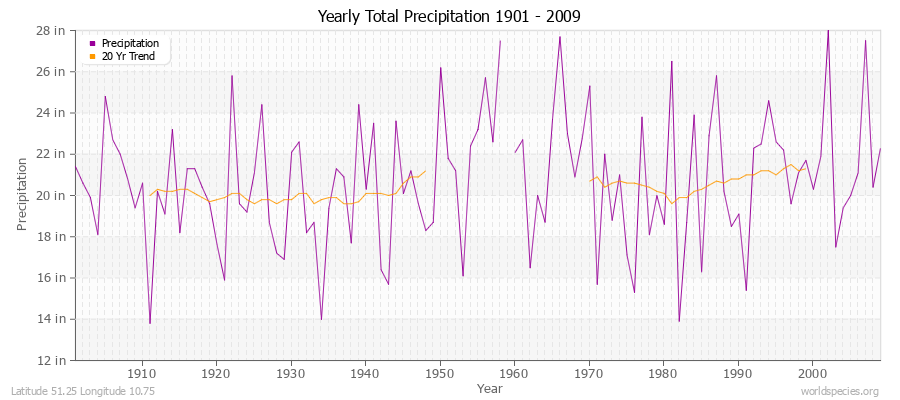
Precipitationin1.31.11.41.52.22.52.52.21.61.51.51.4108 years
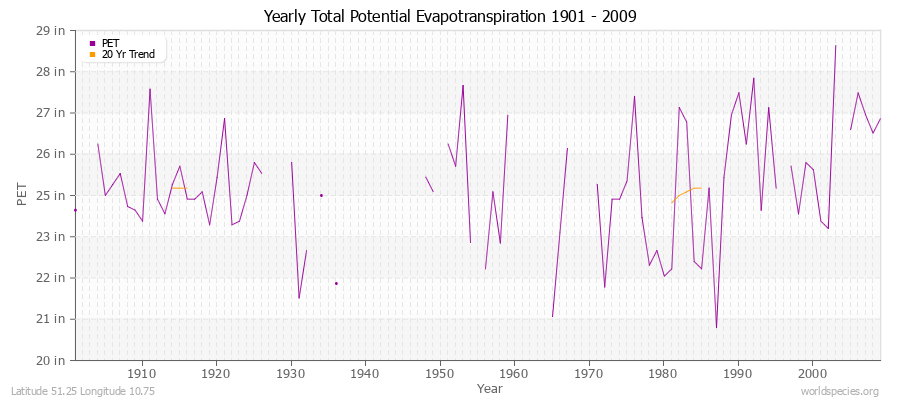
Potential Evapotranspirationin0.40.61.52.43.63.94.23.62.21.20.60.479 years
Yearly Average Temperatures 2010 - 2009 (English) Latitude 51.25 Longitude 10.75
Monthly Mean Temperatures 1901 - 2009 (English) Latitude 51.25 Longitude 10.75
Yearly Total Frost Days 1901 - 2009 Latitude 51.25 Longitude 10.75
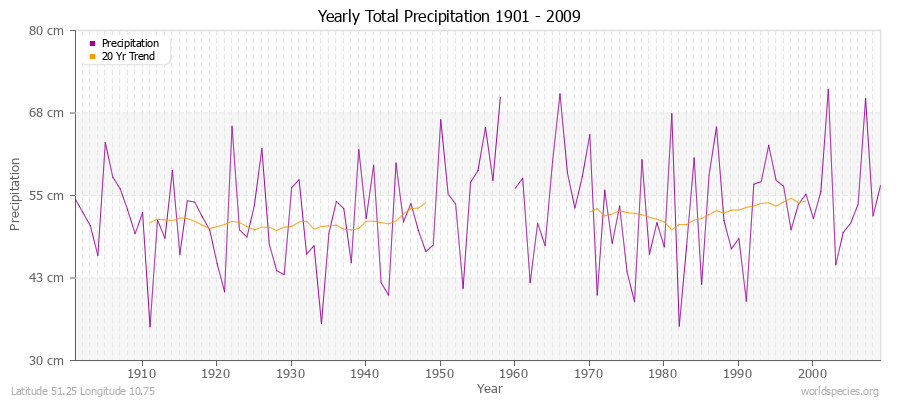
Yearly Total Precipitation 1901 - 2009 (English) Latitude 51.25 Longitude 10.75
Yearly Total Wet Days 1901 - 2009 Latitude 51.25 Longitude 10.75
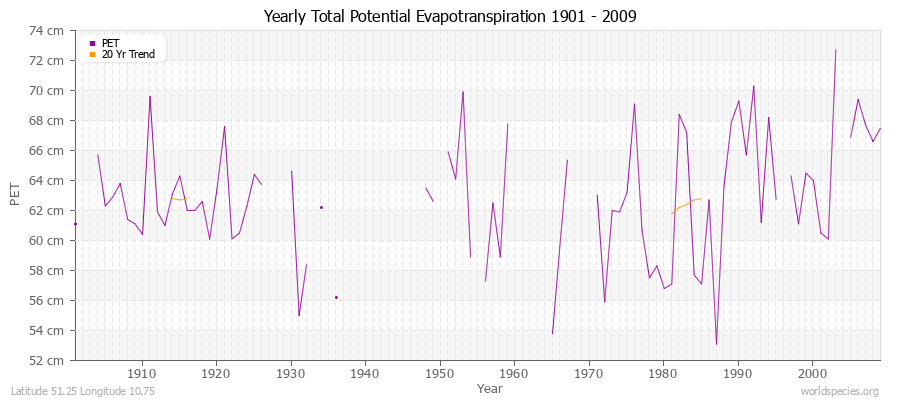
Yearly Total Potential Evapotranspiration 1901 - 2009 (English) Latitude 51.25 Longitude 10.75

Climate data provided by CRU TS 3.1 - University of East Anglia Climate Research Unit (CRU). [Phil Jones, Ian Harris]. CRU Time Series (TS) high resolution gridded datasets, [Internet]. NCAS British Atmospheric Data Centre, 2008, Accessed: 28-July-2011
Charting software provided by pChart - a PHP class to build charts.
Köppen climate classification provided by Kottek, M., J. Grieser, C. Beck, B. Rudolf, and F. Rubel, 2006: World Map of Köppen-Geiger Climate Classification updated. Meteorol. Z., 15, 259-263
The calculation method for the potential evapotranspiration is the FAO grass reference equation (Ekstrom et al., 2007, which is based on Allen et al., 1994). It is a variant of the Penman Monteith method using TMP, TMN, TMX, VAP, CLD.