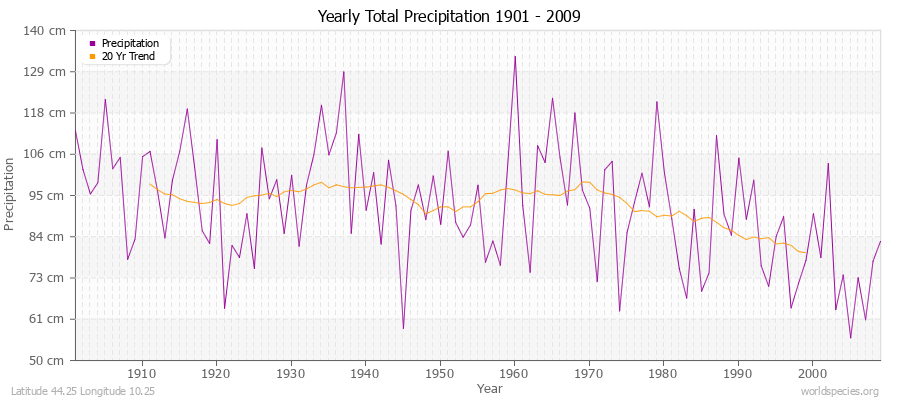
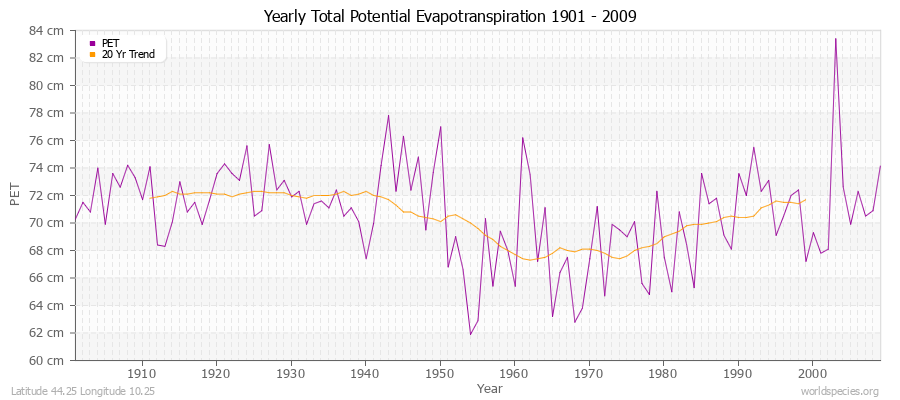
Climate Data for Latitude 44.25 Longitude 10.25Köppen climate classification: Cfb (Climate: warm temperate; Precipitation: fully humid; Temperature: warm summer) Abetina Reale, Alta Val Dolo
Alpi Apuane
Alpi Apuane Regional Nature Park
Apennines from Passo del Cerreto to Monte Caligi
Crinale dellAppennino parmense
Monte Acuto, Alpe di Succiso
Monte la Nuda, Cima Belfiore, Passo del Cerreto
Monte Prado
Monte Ventasso
Praterie primarie e secondarie delle Apuane
Val d'Ozola, Monte Cusna
|
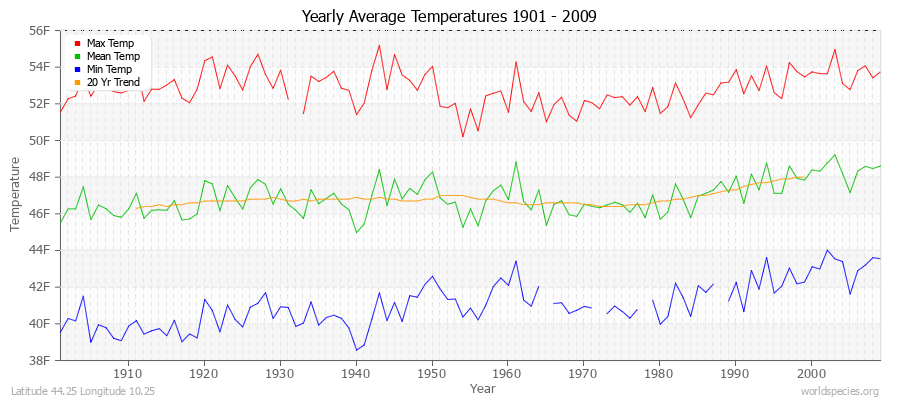
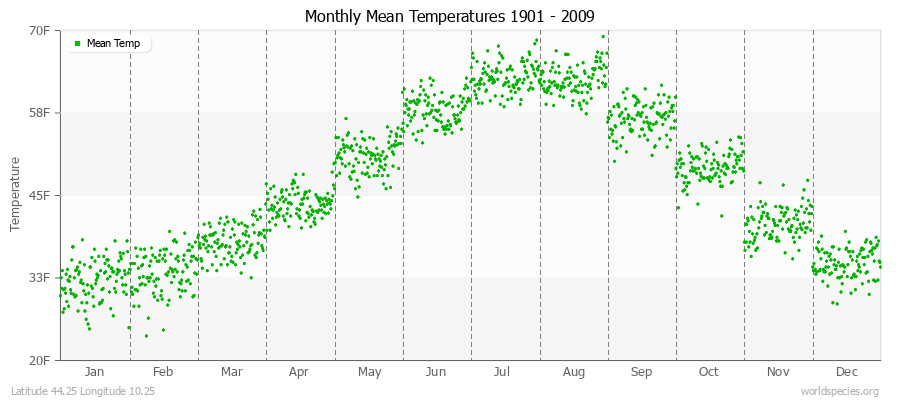
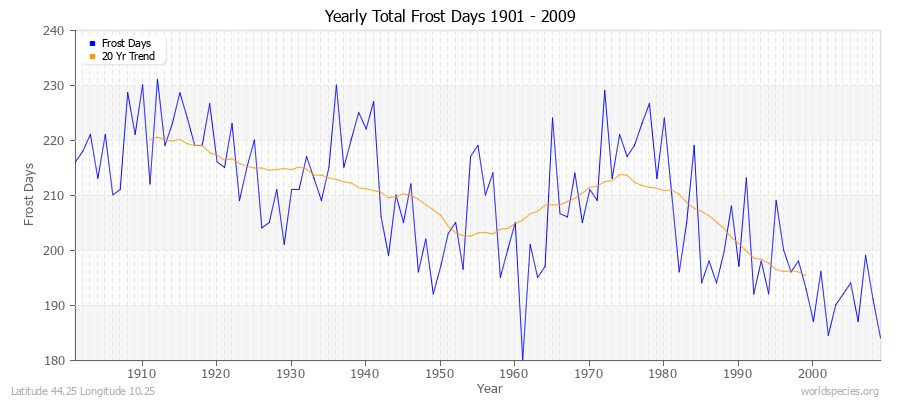
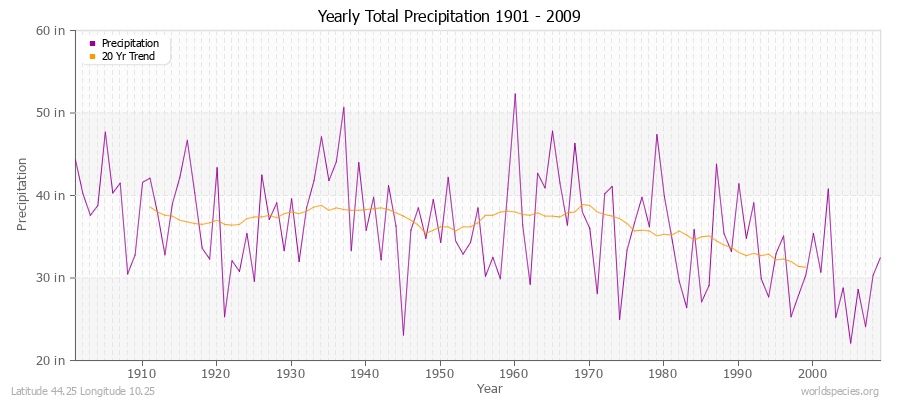
Averages (Metric) English| Type | Units | Jan | Feb | Mar | Apr | May | Jun | Jul | Aug | Sep | Oct | Nov | Dec | Period |
|---|
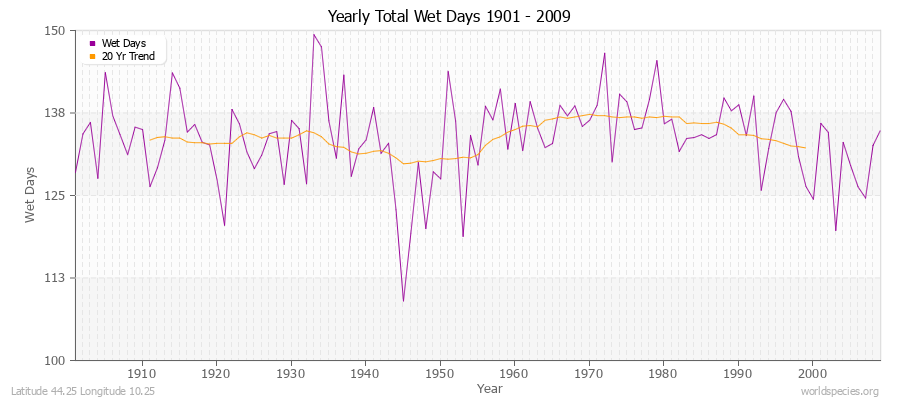
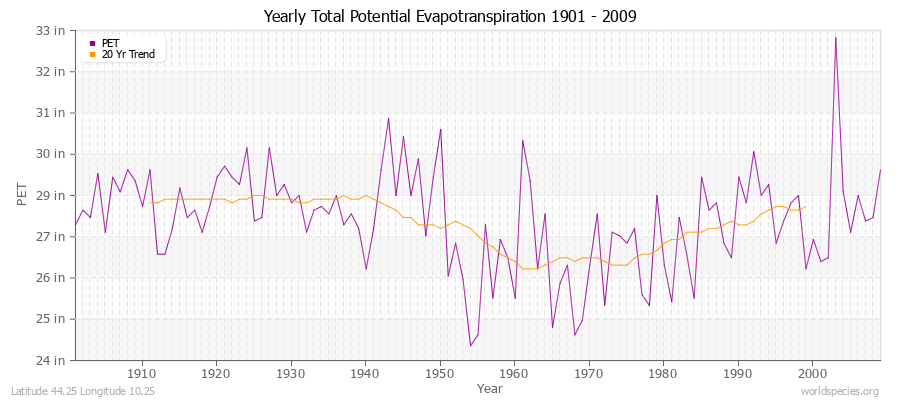
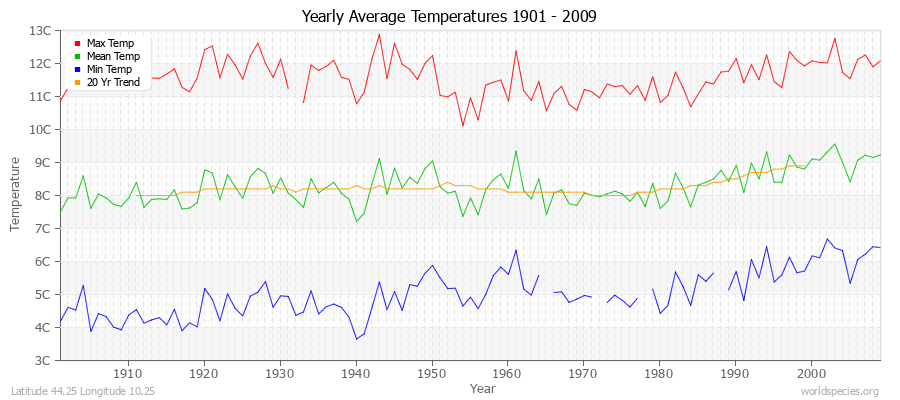
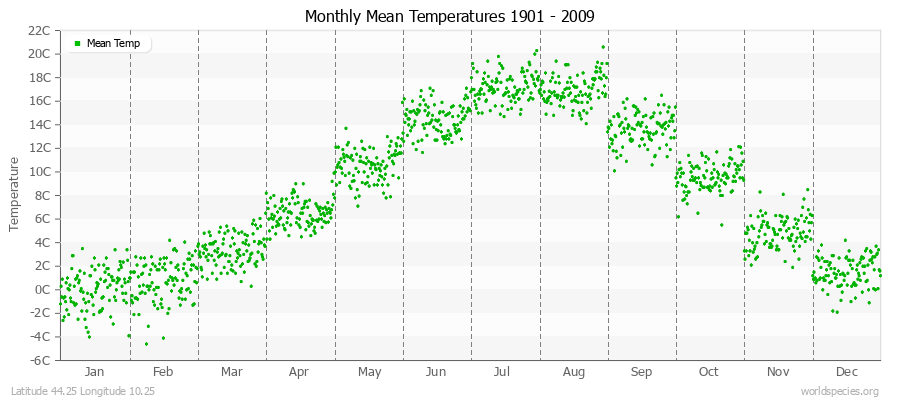
| Min Temp | C° | -2.6 | -2.3 | -0.0 | 3.0 | 7.0 | 10.8 | 13.3 | 13.1 | 10.1 | 6.5 | 2.5 | -1.0 | 105 years | | Mean Temp | C° | 0.1 | 0.7 | 3.3 | 6.5 | 10.5 | 14.4 | 17.2 | 17.0 | 13.7 | 9.6 | 4.8 | 1.5 | 109 years | | Max Temp | C° | 2.8 | 3.8 | 6.7 | 10.0 | 14.2 | 18.2 | 21.1 | 20.9 | 17.3 | 12.7 | 7.3 | 3.9 | 108 years | | Frost | Days | 31.0 | 28.2 | 30.9 | 24.0 | 7.6 | 3.5 | 2.3 | 2.8 | 8.5 | 14.5 | 24.7 | 31.0 | 109 years | | Wet | Days | 11.7 | 10.9 | 12.5 | 14.2 | 13.1 | 11.3 | 7.3 | 8.7 | 8.8 | 10.8 | 13.1 | 11.3 | 109 years | | Precipitation | mm | 68.3 | 64.2 | 70.4 | 73.5 | 74.2 | 64.8 | 47.9 | 61.3 | 89.8 | 120.3 | 104.1 | 80.5 | 109 years | | Potential Evapotranspiration | mm | 23.3 | 26.2 | 41.3 | 53.8 | 78.4 | 96.3 | 119.0 | 102.5 | 69.5 | 46.6 | 26.1 | 23.4 | 109 years |
Averages (English) Metric| Type | Units | Jan | Feb | Mar | Apr | May | Jun | Jul | Aug | Sep | Oct | Nov | Dec | Period |
|---|
| Min Temp | F° | 27.3 | 27.8 | 31.9 | 37.4 | 44.6 | 51.5 | 55.9 | 55.6 | 50.3 | 43.6 | 36.5 | 30.3 | 105 years | | Mean Temp | F° | 32.2 | 33.3 | 37.9 | 43.6 | 51.0 | 58.0 | 62.9 | 62.5 | 56.6 | 49.2 | 40.7 | 34.7 | 109 years | | Max Temp | F° | 37.0 | 38.8 | 44.0 | 50.0 | 57.5 | 64.7 | 70.0 | 69.6 | 63.1 | 54.9 | 45.1 | 39.1 | 108 years | | Frost | Days | 31.0 | 28.2 | 30.9 | 24.0 | 7.6 | 3.5 | 2.3 | 2.8 | 8.5 | 14.5 | 24.7 | 31.0 | 109 years | | Wet | Days | 11.7 | 10.9 | 12.5 | 14.2 | 13.1 | 11.3 | 7.3 | 8.7 | 8.8 | 10.8 | 13.1 | 11.3 | 109 years | | Precipitation | in | 2.7 | 2.5 | 2.8 | 2.9 | 2.9 | 2.5 | 1.9 | 2.4 | 3.5 | 4.7 | 4.1 | 3.2 | 109 years | | Potential Evapotranspiration | in | 0.9 | 1.0 | 1.6 | 2.1 | 3.1 | 3.8 | 4.7 | 4.0 | 2.7 | 1.8 | 1.0 | 0.9 | 109 years |
Climate data provided by CRU TS 3.1 - University of East Anglia Climate Research Unit (CRU). [Phil Jones, Ian Harris]. CRU Time Series (TS) high resolution gridded datasets, [Internet]. NCAS British Atmospheric Data Centre, 2008, Accessed: 28-July-2011 Charting software provided by pChart - a PHP class to build charts. The calculation method for the potential evapotranspiration is the FAO grass reference equation (Ekstrom et al., 2007, which is based on Allen et al., 1994).
It is a variant of the Penman Monteith method using TMP, TMN, TMX, VAP, CLD.
|