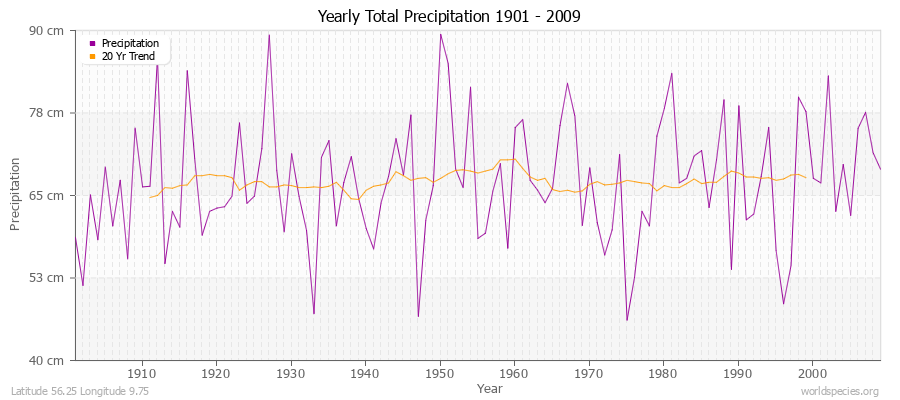
Climate Data for Latitude 56.25 Longitude 9.75Köppen climate classification: Cfb (Climate: warm temperate; Precipitation: fully humid; Temperature: warm summer) Gudenå og Gjern Bakker
Lillering Skov, Stjær Skov, Tåstrup Skov og Tåstrup Mose
Salten Å, Salten Langsø, Mossø og søer syd for Salten Langsø og dele af Gudenå
Silkeborgskovene
Yding Skov og Ejer Skov
|
Averages (Metric) English| Type | Units | Jan | Feb | Mar | Apr | May | Jun | Jul | Aug | Sep | Oct | Nov | Dec | Period |
|---|
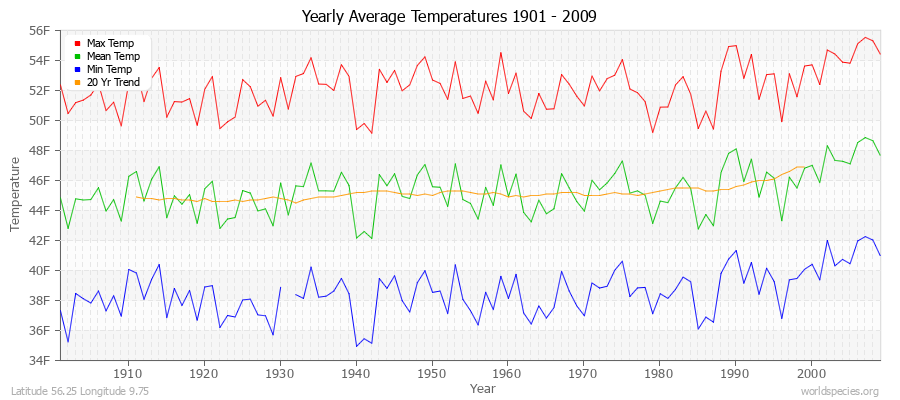
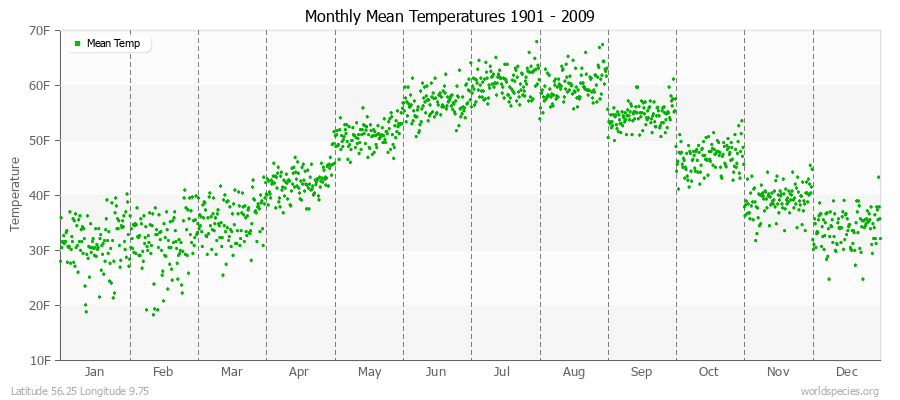
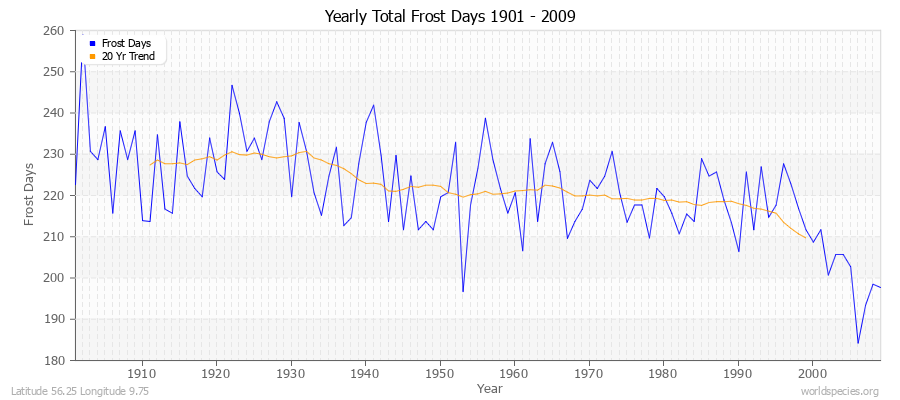
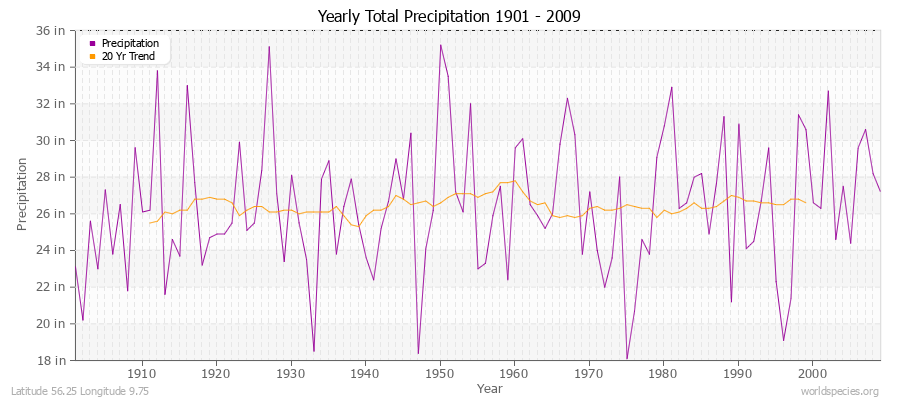
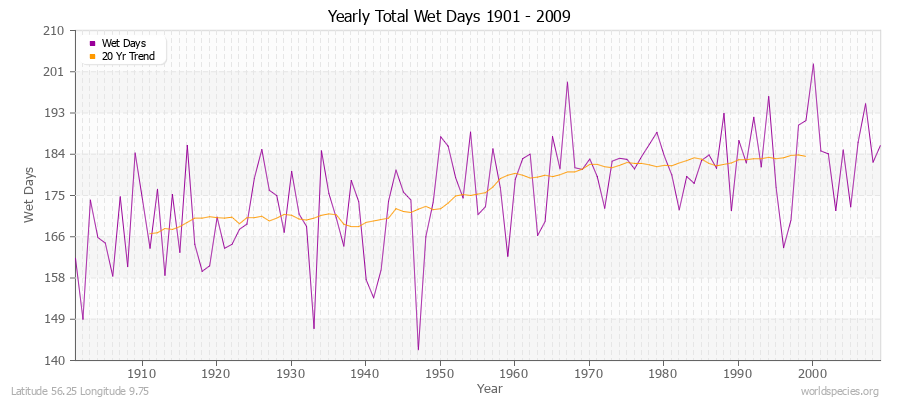
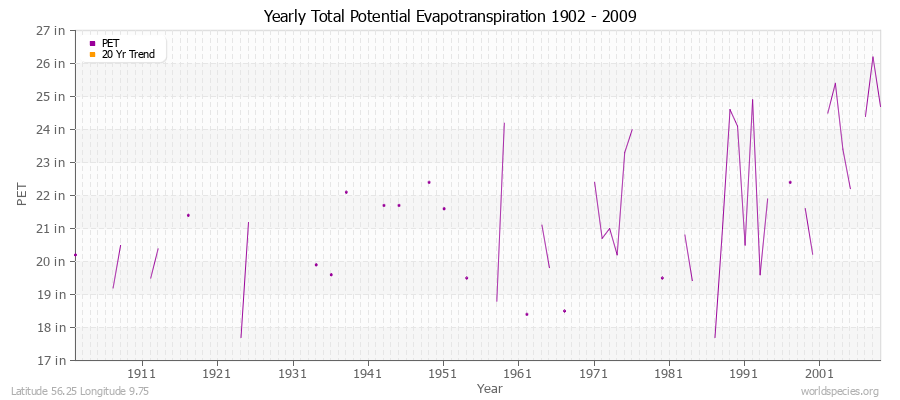
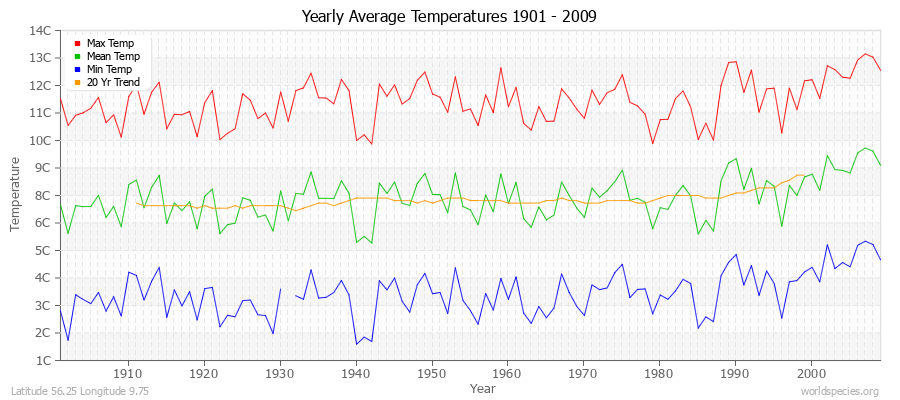
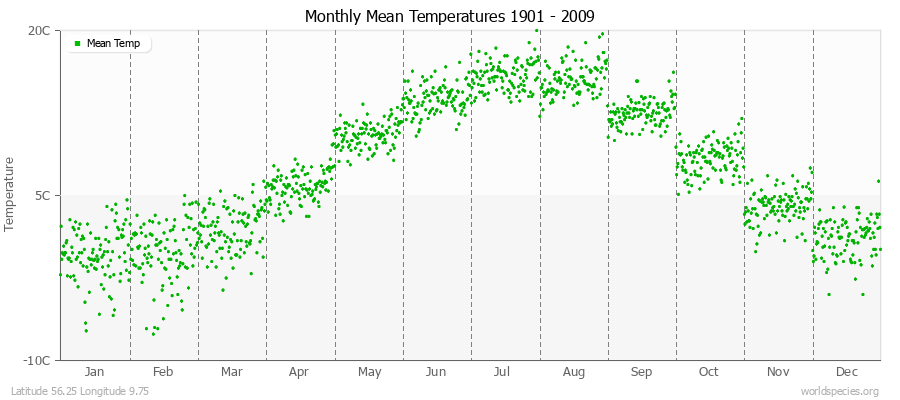
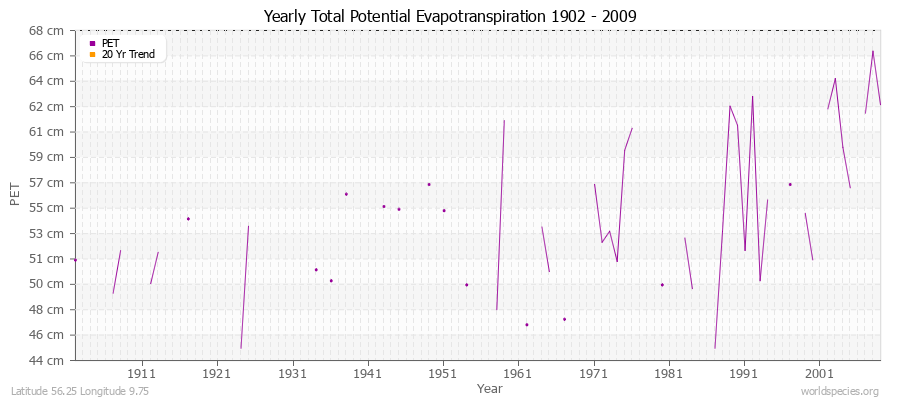
| Min Temp | C° | -2.8 | -3.0 | -1.3 | 1.5 | 5.4 | 8.7 | 11.0 | 10.8 | 8.4 | 5.0 | 1.4 | -1.4 | 108 years | | Mean Temp | C° | -0.3 | -0.3 | 1.9 | 5.8 | 10.5 | 13.7 | 15.9 | 15.6 | 12.5 | 8.3 | 4.0 | 1.1 | 109 years | | Max Temp | C° | 2.2 | 2.5 | 5.1 | 10.2 | 15.6 | 18.8 | 20.8 | 20.4 | 16.7 | 11.7 | 6.7 | 3.6 | 109 years | | Frost | Days | 30.9 | 28.2 | 30.9 | 23.7 | 13.9 | 7.8 | 0.3 | 1.2 | 6.7 | 21.1 | 25.8 | 31.0 | 109 years | | Wet | Days | 19.2 | 12.2 | 14.6 | 11.9 | 11.5 | 12.0 | 12.8 | 13.5 | 14.5 | 16.1 | 19.4 | 18.0 | 109 years | | Precipitation | mm | 57.4 | 39.5 | 41.7 | 37.8 | 41.8 | 52.3 | 64.6 | 68.7 | 64.5 | 71.5 | 70.3 | 60.4 | 109 years | | Potential Evapotranspiration | mm | 8.3 | 12.7 | 26.1 | 51.2 | 82.9 | 94.0 | 98.4 | 82.8 | 50.1 | 22.6 | 7.7 | 7.2 | 49 years |
Averages (English) Metric| Type | Units | Jan | Feb | Mar | Apr | May | Jun | Jul | Aug | Sep | Oct | Nov | Dec | Period |
|---|
| Min Temp | F° | 26.9 | 26.7 | 29.7 | 34.7 | 41.7 | 47.7 | 51.8 | 51.4 | 47.2 | 41.0 | 34.5 | 29.4 | 108 years | | Mean Temp | F° | 31.4 | 31.5 | 35.4 | 42.5 | 50.9 | 56.7 | 60.6 | 60.0 | 54.6 | 47.0 | 39.2 | 34.0 | 109 years | | Max Temp | F° | 35.9 | 36.4 | 41.3 | 50.3 | 60.2 | 65.9 | 69.4 | 68.7 | 62.1 | 53.0 | 44.0 | 38.5 | 109 years | | Frost | Days | 30.9 | 28.2 | 30.9 | 23.7 | 13.9 | 7.8 | 0.3 | 1.2 | 6.7 | 21.1 | 25.8 | 31.0 | 109 years | | Wet | Days | 19.2 | 12.2 | 14.6 | 11.9 | 11.5 | 12.0 | 12.8 | 13.5 | 14.5 | 16.1 | 19.4 | 18.0 | 109 years | | Precipitation | in | 2.3 | 1.6 | 1.6 | 1.5 | 1.6 | 2.1 | 2.5 | 2.7 | 2.5 | 2.8 | 2.8 | 2.4 | 109 years | | Potential Evapotranspiration | in | 0.3 | 0.5 | 1.0 | 2.0 | 3.3 | 3.7 | 3.9 | 3.3 | 2.0 | 0.9 | 0.3 | 0.3 | 49 years |
Climate data provided by CRU TS 3.1 - University of East Anglia Climate Research Unit (CRU). [Phil Jones, Ian Harris]. CRU Time Series (TS) high resolution gridded datasets, [Internet]. NCAS British Atmospheric Data Centre, 2008, Accessed: 28-July-2011 Charting software provided by pChart - a PHP class to build charts. The calculation method for the potential evapotranspiration is the FAO grass reference equation (Ekstrom et al., 2007, which is based on Allen et al., 1994).
It is a variant of the Penman Monteith method using TMP, TMN, TMX, VAP, CLD.
|