Climate Data for Latitude 50.75 Longitude 4.75

Köppen climate classification: Cfb (Climate: warm temperate; Precipitation: fully humid; Temperature: warm summer)
 

Locations

Download
Carrière de Dongelberg (Jodoigne)
Carrières souterraines d'Orp-Jauche (Orp-Jauche)
De Dijlevallei
De Dijlevallei
Etangs de Boneffe (Eghezée)
Vallée de l'Orneau (Gembloux; Jemeppe-sur-Sambre; Perwez)
Vallée de la Dyle à Ottignies (Ottignies-Louvain-la-Neuve; Wavre)
Vallée de la Dyle de Wavre à Archennes (Grez-Doiceau)
Vallée de la Dyle en aval d'Archennes (Grez-Doiceau)
Vallée de la Lasne (Rixensart; Wavre)
Vallée de la Thyle (Court-Saint-Etienne; Genappe; Les Bons Villers; Villers-la-Ville)
Vallée du Train (Chaumont-Gistoux)
Valleien van de Dijle, Laan en IJse met aangrenzende bos- en moerasgebieden
Valleien van de Winge en de Motte met valleihellingen.

Averages (English) Metric

TypeUnitsJanFebMarAprMayJunJulAugSepOctNovDecPeriod
Min Temp31.431.135.138.946.151.154.654.450.144.037.533.3103 years
Mean Temp36.137.042.548.055.760.864.063.958.651.242.637.7109 years
Max Temp40.842.950.157.365.370.773.673.467.458.548.042.1109 years
FrostDays29.728.125.013.59.73.31.62.74.413.220.129.67 years
WetDays20.515.918.115.916.114.614.214.415.515.919.620.2109 years
Precipitationin2.62.12.32.12.42.63.02.92.42.82.92.9109 years
Potential Evapotranspirationin0.50.81.62.63.74.14.33.92.51.40.60.388 years
Yearly Average Temperatures 2010 - 2009 (English) Latitude 50.75 Longitude 4.75
Monthly Mean Temperatures 1901 - 2009 (English) Latitude 50.75 Longitude 4.75
Yearly Total Frost Days 1902 - 2009 Latitude 50.75 Longitude 4.75
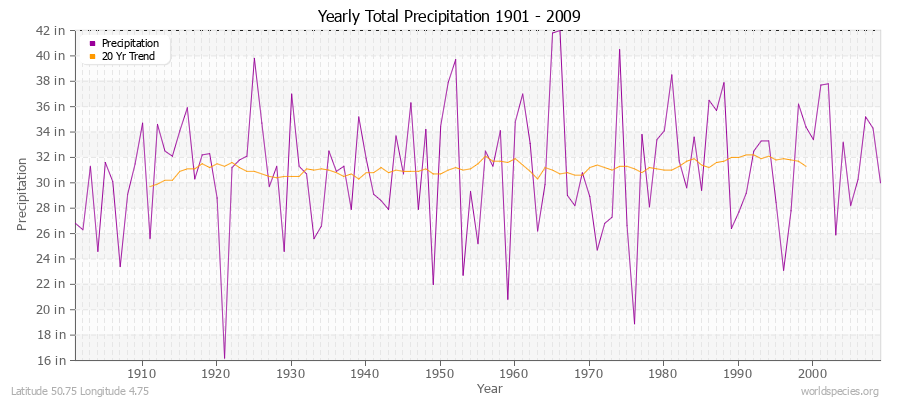
Yearly Total Precipitation 1901 - 2009 (English) Latitude 50.75 Longitude 4.75
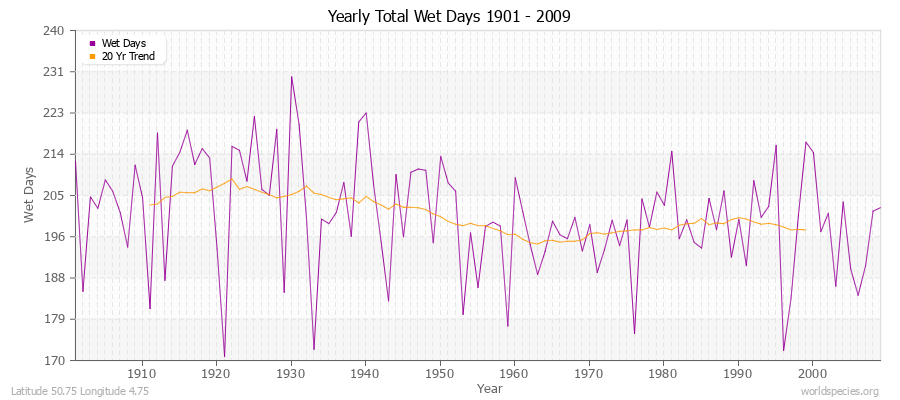
Yearly Total Wet Days 1901 - 2009 Latitude 50.75 Longitude 4.75
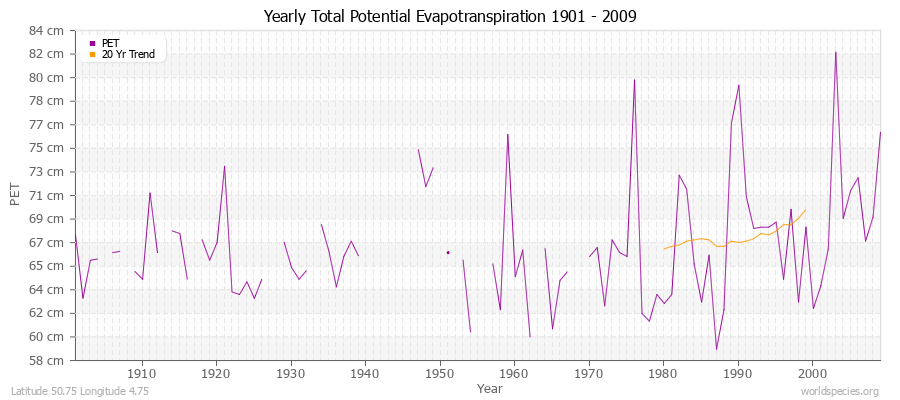
Yearly Total Potential Evapotranspiration 1901 - 2009 (English) Latitude 50.75 Longitude 4.75

Climate data provided by CRU TS 3.1 - University of East Anglia Climate Research Unit (CRU). [Phil Jones, Ian Harris]. CRU Time Series (TS) high resolution gridded datasets, [Internet]. NCAS British Atmospheric Data Centre, 2008, Accessed: 28-July-2011
Charting software provided by pChart - a PHP class to build charts.
Köppen climate classification provided by Kottek, M., J. Grieser, C. Beck, B. Rudolf, and F. Rubel, 2006: World Map of Köppen-Geiger Climate Classification updated. Meteorol. Z., 15, 259-263
The calculation method for the potential evapotranspiration is the FAO grass reference equation (Ekstrom et al., 2007, which is based on Allen et al., 1994). It is a variant of the Penman Monteith method using TMP, TMN, TMX, VAP, CLD.