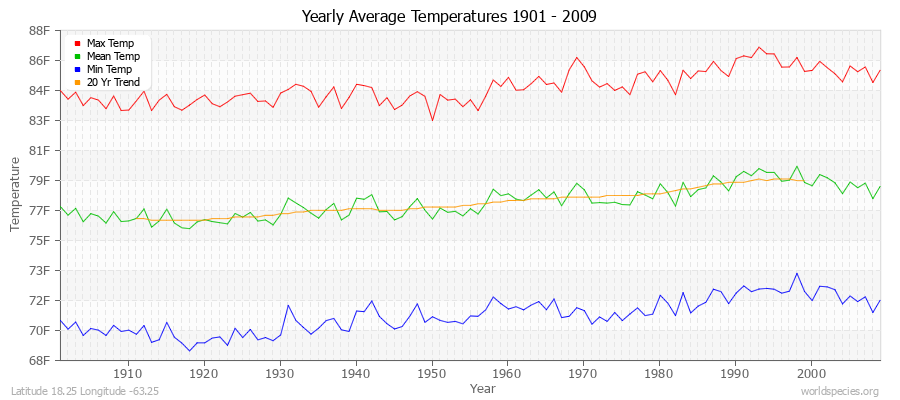
Climate Data for Latitude 18.25 Longitude -63.25Köppen climate classification: Aw (Climate: equatorial; Precipitation: winter dry) Cove Pond
Dog Island
Fort Amsterdam, Sint Maarten
Fresh Pond, Sint Maarten
Grand Etang
Great Salt Pond, Sint Maarten
Little Bay, Sint Maarten
Long Pond
Pelikan Rock, Sint Maarten
Pic Paradis
Prickly Pear (East and West)
|
Averages (Metric) English| Type | Units | Jan | Feb | Mar | Apr | May | Jun | Jul | Aug | Sep | Oct | Nov | Dec | Period |
|---|
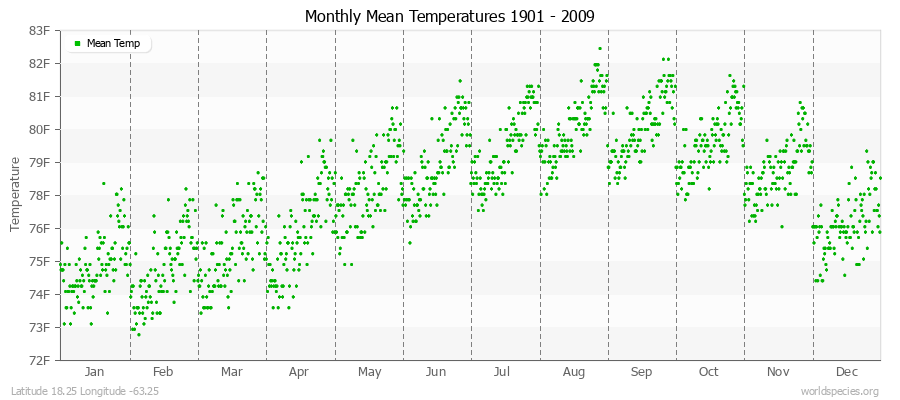
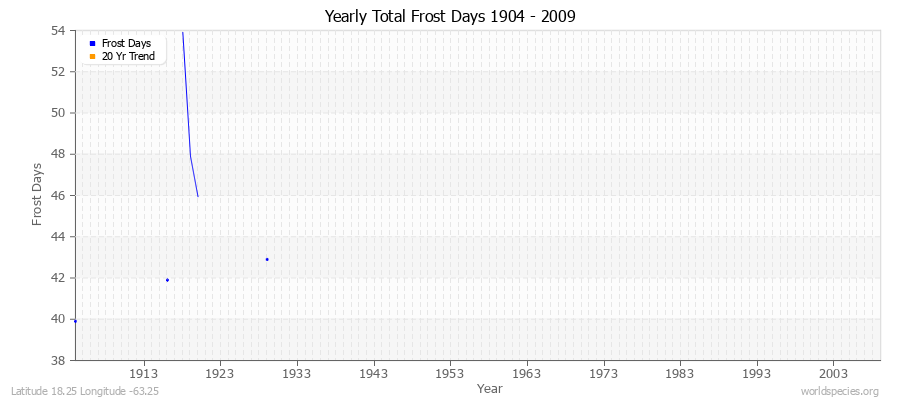
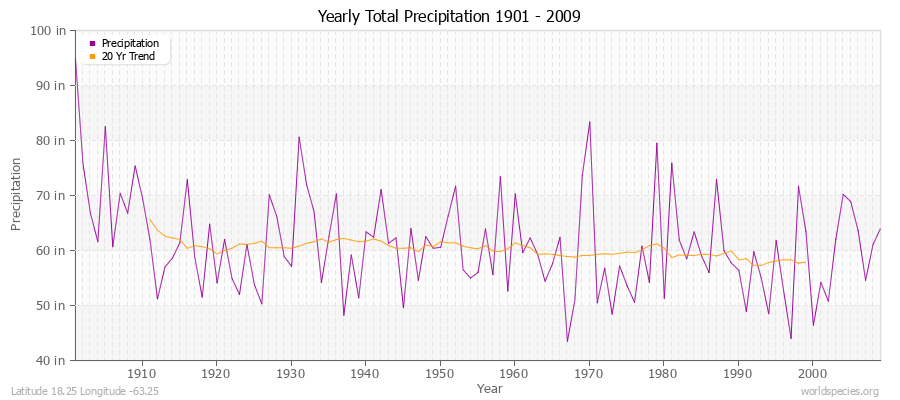
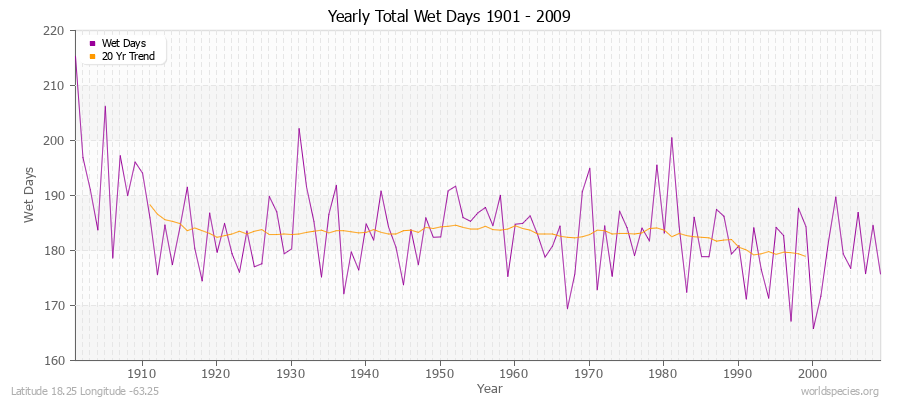
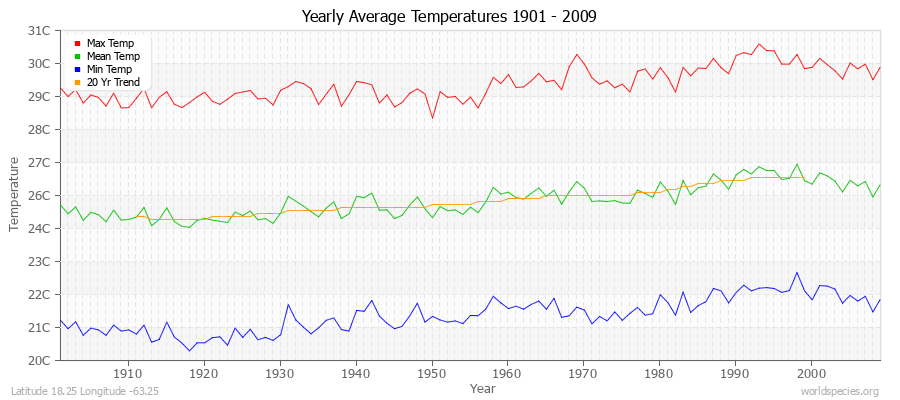
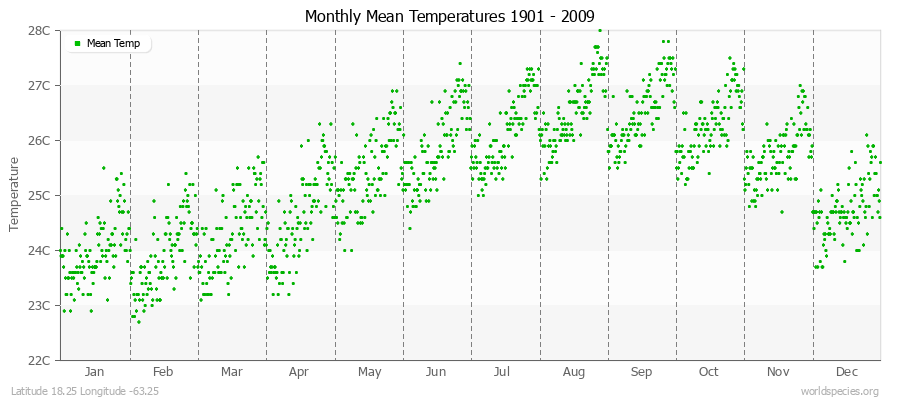
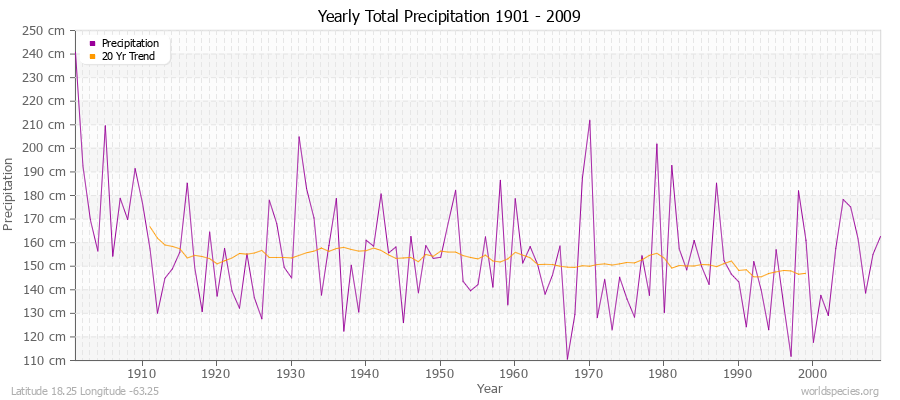
| Min Temp | C° | 20.1 | 20.0 | 20.3 | 20.6 | 21.7 | 22.3 | 22.3 | 22.7 | 22.7 | 22.3 | 22.0 | 21.1 | 109 years | | Mean Temp | C° | 24.0 | 23.9 | 24.3 | 24.6 | 25.4 | 25.9 | 26.1 | 26.5 | 26.5 | 26.3 | 25.7 | 24.7 | 109 years | | Max Temp | C° | 27.9 | 27.9 | 28.4 | 28.6 | 29.2 | 29.5 | 30.0 | 30.4 | 30.4 | 30.2 | 29.5 | 28.5 | 109 years | | Frost | Days | 3.1 | 4.1 | 4.1 | 5.2 | 0.4 | 6.4 | 5.9 | 5.4 | 1.8 | 1.2 | 3.7 | 4.1 | 6 years | | Wet | Days | 15.9 | 10.1 | 8.9 | 9.6 | 11.4 | 15.1 | 17.6 | 18.4 | 22.7 | 20.2 | 18.4 | 15.2 | 109 years | | Precipitation | mm | 96.0 | 68.5 | 56.3 | 92.0 | 139.7 | 142.1 | 152.8 | 163.4 | 211.8 | 152.9 | 159.3 | 116.2 | 109 years |
Averages (English) Metric| Type | Units | Jan | Feb | Mar | Apr | May | Jun | Jul | Aug | Sep | Oct | Nov | Dec | Period |
|---|
| Min Temp | F° | 68.2 | 68.0 | 68.5 | 69.1 | 71.0 | 72.1 | 72.2 | 72.9 | 72.9 | 72.2 | 71.6 | 70.0 | 109 years | | Mean Temp | F° | 75.1 | 75.0 | 75.7 | 76.3 | 77.8 | 78.6 | 79.0 | 79.8 | 79.7 | 79.3 | 78.3 | 76.5 | 109 years | | Max Temp | F° | 82.1 | 82.2 | 83.1 | 83.5 | 84.6 | 85.1 | 86.0 | 86.7 | 86.7 | 86.4 | 85.1 | 83.2 | 109 years | | Frost | Days | 3.1 | 4.1 | 4.1 | 5.2 | 0.4 | 6.4 | 5.9 | 5.4 | 1.8 | 1.2 | 3.7 | 4.1 | 6 years | | Wet | Days | 15.9 | 10.1 | 8.9 | 9.6 | 11.4 | 15.1 | 17.6 | 18.4 | 22.7 | 20.2 | 18.4 | 15.2 | 109 years | | Precipitation | in | 3.8 | 2.7 | 2.2 | 3.6 | 5.5 | 5.6 | 6.0 | 6.4 | 8.3 | 6.0 | 6.3 | 4.6 | 109 years |
Climate data provided by CRU TS 3.1 - University of East Anglia Climate Research Unit (CRU). [Phil Jones, Ian Harris]. CRU Time Series (TS) high resolution gridded datasets, [Internet]. NCAS British Atmospheric Data Centre, 2008, Accessed: 28-July-2011 Charting software provided by pChart - a PHP class to build charts. The calculation method for the potential evapotranspiration is the FAO grass reference equation (Ekstrom et al., 2007, which is based on Allen et al., 1994).
It is a variant of the Penman Monteith method using TMP, TMN, TMX, VAP, CLD.
|