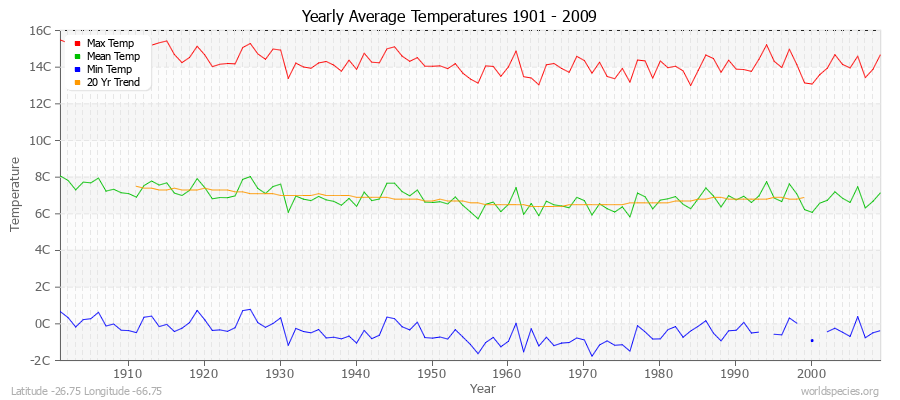
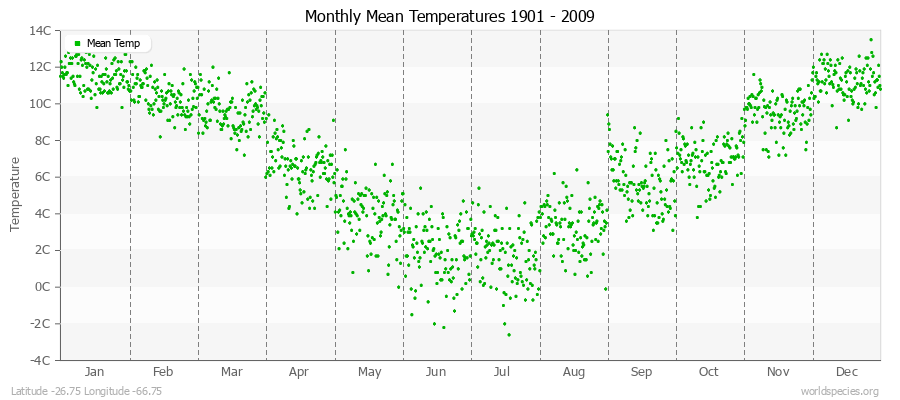
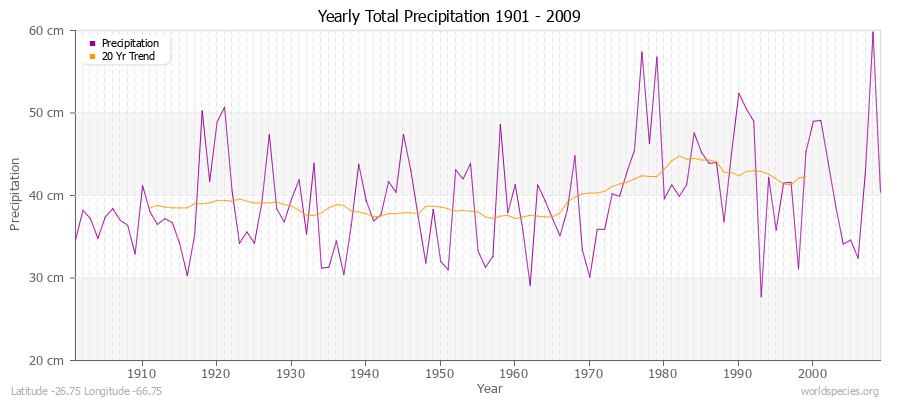
Climate Data for Latitude -26.75 Longitude -66.75Köppen climate classification: Cwc (Climate: warm temperate; Precipitation: winter dry; Temperature: cool summer)
Averages (English) Metric
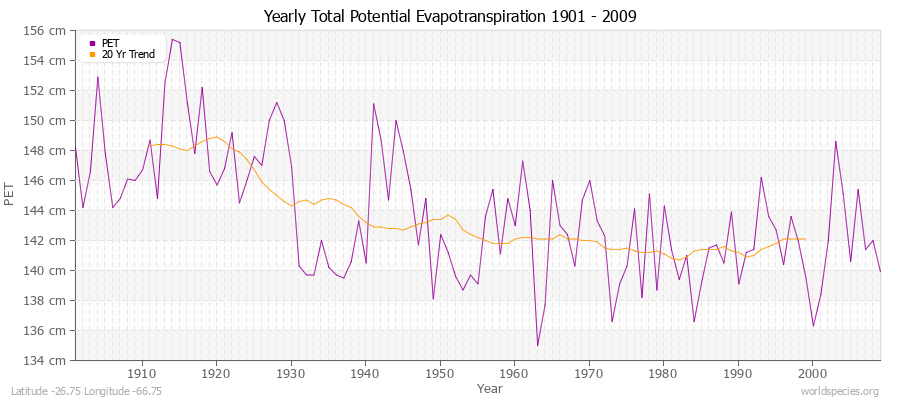
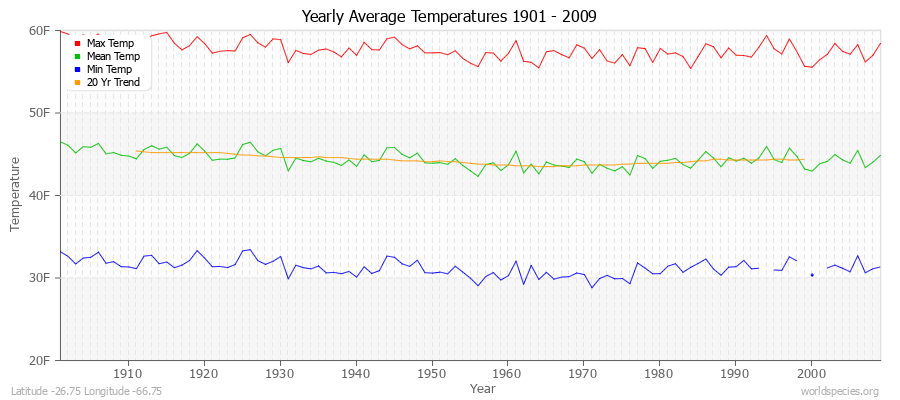 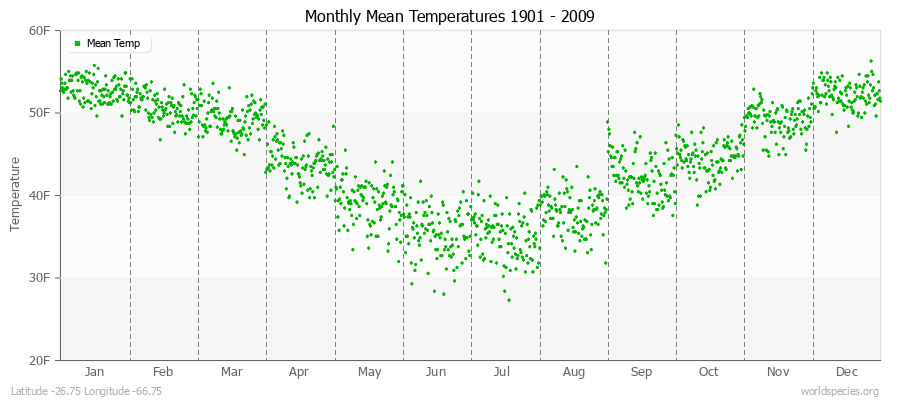 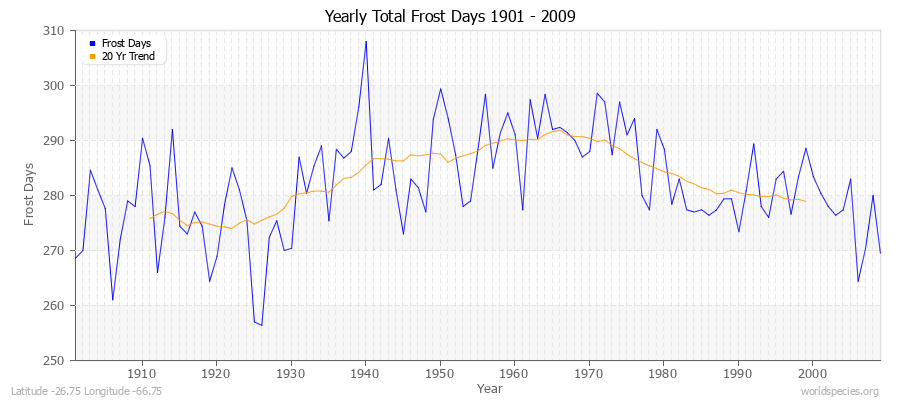 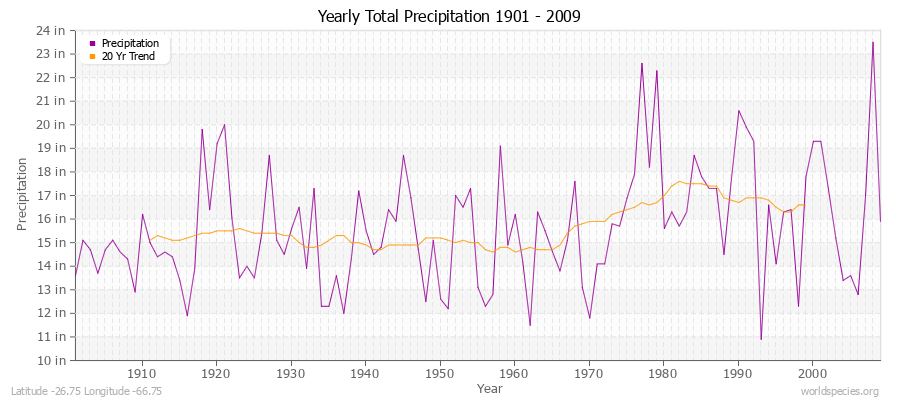 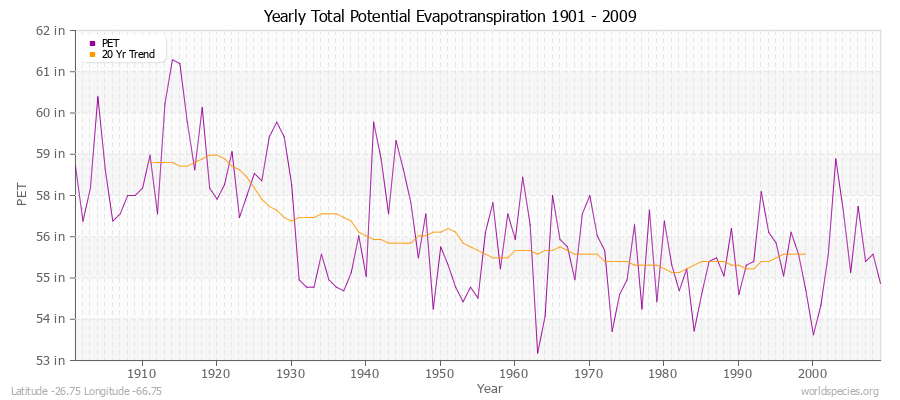 Climate data provided by CRU TS 3.1 - University of East Anglia Climate Research Unit (CRU). [Phil Jones, Ian Harris]. CRU Time Series (TS) high resolution gridded datasets, [Internet]. NCAS British Atmospheric Data Centre, 2008, Accessed: 28-July-2011 Charting software provided by pChart - a PHP class to build charts. Köppen climate classification provided by Kottek, M., J. Grieser, C. Beck, B. Rudolf, and F. Rubel, 2006: World Map of Köppen-Geiger Climate Classification updated. Meteorol. Z., 15, 259-263 The calculation method for the potential evapotranspiration is the FAO grass reference equation (Ekstrom et al., 2007, which is based on Allen et al., 1994).
It is a variant of the Penman Monteith method using TMP, TMN, TMX, VAP, CLD.
|
